





Weekly Recap Week Ahead What Just Happened
Have a great weekend, stay safe, and make sure to wash your hands!!
Share this:

I don’t even know where to start:
- The coronavirus has spread outside of China
- More and more companies are lowering guidance for Q1
- Economists are forecasting Central Bank rate cuts as the global economy grinds to a halt
- Global stock markets are melting down 10%-15% from all-time highs, many of the highs hit less than 2 weeks ago. This past week: DAX -12.3%, FTSE -10.8%, S&P 500 – 12%. This has caused the VIX to spike 139%. (190% at one point).
- US 10-year yields and US 30-year yields put in all time new lows at 1.114% and 1.653% respectively.
- On Friday, the World Health Organization (WHO) raised the global risk for the coronavirus from “HIGH” to “VERY HIGH” (whatever that means).
As stock markets came off, the carry trade has been unwinding. The idea behind a carry trade is that when a currency has a low yield, traders “borrow” money from the lower yielding currency (such as Euros) and buy stronger, riskier yielding assets, such as stocks or the Mexican Peso. However, when the stock market falls, these traders must sell stocks and buy back (or pay back) the currency it borrowed, such as the Euro. This is most likely why EUR/MXN is up +6.5%. The ECB has rates set at -0.5%, while the Bank of Mexico has recently cut rates to 7%. Because of the unwinding of the carry trade, EUR/USD is up 1.6% from near 1.0800 to near 1.1050 this week. For a currency pair that has traditionally moved with stocks, this is a large move, relatively speaking.
The Australian Dollar and New Zealand Dollar have been hit this week, as their economies are closely aligned with Chinas. New Zealand also reported its first case of the coronavirus on Friday. AUD/USD and NZD/USD are both down 1.5% this week. In an unrelated note, EUR/GBP is up over +3% this week, but this has more to do with UK-EU trade negotiations than it does with the coronavirus.
The flight to safety was in full effect this week, as Japanese officials halted their buying of Euros and US Dollars and let the Yen gain. USD/JPY was down 3.3% this week. This could have been a much larger loss had it not been for the GPIF (Japan’s largest pension fund) on the bid earlier in the week, allegedly.
But what happened to precious metals? Someone forgot to give gold and silver the memo that this was a risk off week. Spot gold is down -3.6% on the week and silver is down -10.26%. Both assets put in bearish engulfing weekly candles.
Because of a lack of demand for oil, Crude Oil has fallen over -16% this week and is currently trading near $44.50. OPEC will hold a meeting next week to try and determine how to halt falling prices, as Saudi Aramco has recently announced they are supplying China with 500,000 barrels less a day than normal.
Central Banks, including the US Federal Reserve said they will do whatever is needed to support the economy. The next Fed rate decision meeting isn’t until March 18th, however if things continue to worsen, there is no reason for the Fed to not cut inter-meeting. China is providing massive stimulus, such as lending to banks. Hong Kong is giving away $1200 a person. The SNB said they will cut if necessary. RBC said the expect Canada to now cut rates at their rate decision meeting next week, and Goldman Sachs expects the Fed to cut 3 times in 2020, from a previous forecast of 1 time.
The Week Ahead
This week we are likely to see more volatility. In addition to more likely cases of the coronavirus in the US and across the globe, we will have beginning of month economic data, primary elections, more volatility, and more worldwide government official comments, most likely including the WHO, CDC, the Trump administration (watch to see if it is “contained” in US), and Central Banks.
Along with Saturday’s South Carolina Democratic Primaries, “Super Tuesday” will be the most important date before the US election. 15 Democratic primaries will be held on March 3rd to help determine who will run for President vs Donald Trump. This is the most primaries on any day before the election. Included on Super Tuesday is California, which has the most delegates to offer in the country (415). Currently, Sanders (45) is in the lead, followed by Buttigieg (26), Biden(15), Warren (8) and Klobucjar (7). But that can all change on Tuesday with a total of 1,357 delegates up for grabs. A total of 1,991 delegates is needed to win the Democratic nomination. In addition, Michael Bloomberg will be on the ballot for the first time, which will add more chaos into the already crowded mix.
In addition, there will be a ton of beginning of month economic data released next week, starting in a few hours with China’s NBS Manufacturing and non-manufacturing PMIs for February. This will be the first look at China data for February and everyone will be focuses how much of a hit China has taken due to the Coronavirus. The Manufacturing PMI expectation is 46 vs 50 last and the non-manufacturing PMI is 53.8 vs 54.1.
Important Economic Data for the first week of March is as follows:
Monday:
- Global Manufacturing PMI data (Feb Final)
- New Zealand: Import and Export Prices (Q4)
- China: Caixin Manufacturing PMI (Feb)
- UK: BOE Consumer Credit (Jan)
- US: ISM Manufacturing PMI (Feb)
Tuesday
- Australia: RBA Interest Rate Decision
- EU: Inflation Rate (Feb)
Wednesday
- New Zealand: Building Permits (Jan)
- Global Services PMIs data (Feb Final)
- Australia: GDP data (Q4)
- China: Caixin Services PMI (Feb)
- EU: Retail Sales (Jan)
- BoC Interest Rate Decision
- US ADP Employment Change (Feb)
- US: ISM Non-manufacturing data (Feb)
- US: Fed Beige Book
- Crude Inventories Data
Thursday
- Australia: Trade Balance (Jan)
- BoE: Gov Carney Speech
- BoC: Gov Poloz Speech
Friday
- Canada: Employment Change (Feb)
- US: Non-Farm Payrolls
Saturday
- China: Trade Balance
Chart to Watch: Weekly S&P 500
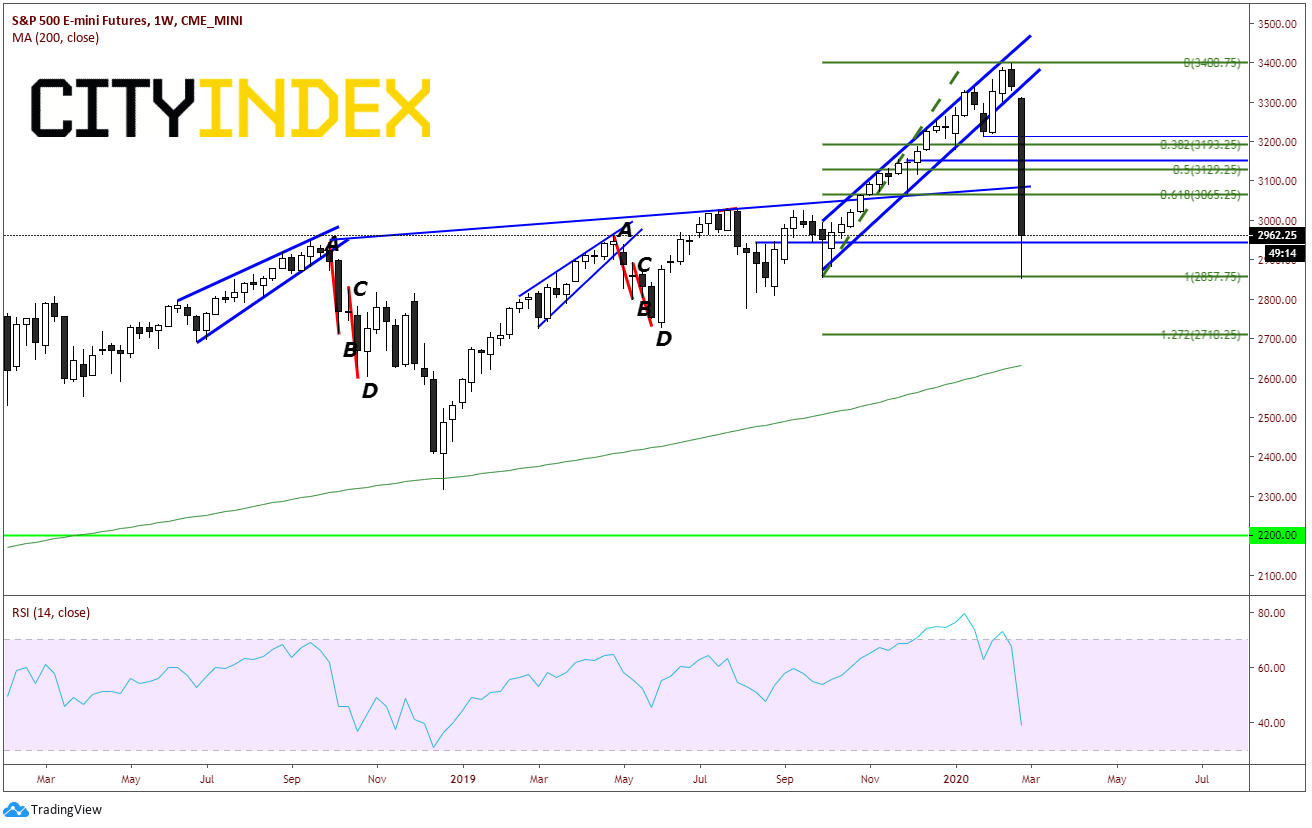
Is there really much to say about this chart? It looks horrible! Price has fallen every day this week and given up 21 weeks of an uptrend. “Up with the Escalator, Down with the Elevator” best describes the price action in this chart. Prices halted at the previously low from the week of September 30th ….for now. This is the largest ever price selloff in the S&P 500 (not in percentage) in one week. Support at today’s lows near 2853.25. The 127% Fibonacci extension from the Sept 30th lows to last weeks high is 2710. There is horizontal support there as well.
Source: Tradingview, CME, City Index
I want to show the daily chart as well. Although we can see how awful price action has been over the last week, take a look at todays “hammer” candlestick. When hammers form at the bottom of and large downtrend, they are often reversal signals (but that doesn’t mean price can’t move towards the lows for the next few days). In addition, notice the RSI on the daily in oversold conditions and turning up. Resistance at the 200 Day Moving Average above near 3050.
Source: Tradingview, CME, City Index
Have a great weekend, stay safe, and make sure to always wash your hands!!
I don’t even know where to start:
- The coronavirus has spread outside of China
- More and more companies are lowering guidance for Q1
- Economists are forecasting Central Bank rate cuts as the global economy grinds to a halt
- Global stock markets are melting down 10%-15% from all-time highs, many of the highs hit less than 2 weeks ago. This past week: DAX -12.3%, FTSE -10.8%, S&P 500 – 12%. This has caused the VIX to spike 139%. (190% at one point).
- US 10-year yields and US 30-year yields put in all time new lows at 1.114% and 1.653% respectively.
- On Friday, the World Health Organization (WHO) raised the global risk for the coronavirus from “HIGH” to “VERY HIGH” (whatever that means).
As stock markets came off, the carry trade has been unwinding. The idea behind a carry trade is that when a currency has a low yield, traders “borrow” money from the lower yielding currency (such as Euros) and buy stronger, riskier yielding assets, such as stocks or the Mexican Peso. However, when the stock market falls, these traders must sell stocks and buy back (or pay back) the currency it borrowed, such as the Euro. This is most likely why EUR/MXN is up +6.5%. The ECB has rates set at -0.5%, while the Bank of Mexico has recently cut rates to 7%. Because of the unwinding of the carry trade, EUR/USD is up 1.6% from near 1.0800 to near 1.1050 this week. For a currency pair that has traditionally moved with stocks, this is a large move, relatively speaking.
The Australian Dollar and New Zealand Dollar have been hit this week, as their economies are closely aligned with Chinas. New Zealand also reported its first case of the coronavirus on Friday. AUD/USD and NZD/USD are both down 1.5% this week. In an unrelated note, EUR/GBP is up over +3% this week, but this has more to do with UK-EU trade negotiations than it does with the coronavirus.
The flight to safety was in full effect this week, as Japanese officials halted their buying of Euros and US Dollars and let the Yen gain. USD/JPY was down 3.3% this week. This could have been a much larger loss had it not been for the GPIF (Japan’s largest pension fund) on the bid earlier in the week, allegedly.
But what happened to precious metals? Someone forgot to give gold and silver the memo that this was a risk off week. Spot gold is down -3.6% on the week and silver is down -10.26%. Both assets put in bearish engulfing weekly candles.
Because of a lack of demand for oil, Crude Oil has fallen over -16% this week and is currently trading near $44.50. OPEC will hold a meeting next week to try and determine how to halt falling prices, as Saudi Aramco has recently announced they are supplying China with 500,000 barrels less a day than normal.
Central Banks, including the US Federal Reserve said they will do whatever is needed to support the economy. The next Fed rate decision meeting isn’t until March 18th, however if things continue to worsen, there is no reason for the Fed to not cut inter-meeting. China is providing massive stimulus, such as lending to banks. Hong Kong is giving away $1200 a person. The SNB said they will cut if necessary. RBC said the expect Canada to now cut rates at their rate decision meeting next week, and Goldman Sachs expects the Fed to cut 3 times in 2020, from a previous forecast of 1 time.
The Week Ahead
This week we are likely to see more volatility. In addition to more likely cases of the coronavirus in the US and across the globe, we will have beginning of month economic data, primary elections, more volatility, and more worldwide government official comments, most likely including the WHO, CDC, the Trump administration (watch to see if it is “contained” in US), and Central Banks.
Along with Saturday’s South Carolina Democratic Primaries, “Super Tuesday” will be the most important date before the US election. 15 Democratic primaries will be held on March 3rd to help determine who will run for President vs Donald Trump. This is the most primaries on any day before the election. Included on Super Tuesday is California, which has the most delegates to offer in the country (415). Currently, Sanders (45) is in the lead, followed by Buttigieg (26), Biden(15), Warren (8) and Klobucjar (7). But that can all change on Tuesday with a total of 1,357 delegates up for grabs. A total of 1,991 delegates is needed to win the Democratic nomination. In addition, Michael Bloomberg will be on the ballot for the first time, which will add more chaos into the already crowded mix.
In addition, there will be a ton of beginning of month economic data released next week, starting in a few hours with China’s NBS Manufacturing and non-manufacturing PMIs for February. This will be the first look at China data for February and everyone will be focuses how much of a hit China has taken due to the Coronavirus. The Manufacturing PMI expectation is 46 vs 50 last and the non-manufacturing PMI is 53.8 vs 54.1.
Important Economic Data for the first week of March is as follows:
Monday:
- Global Manufacturing PMI data (Feb Final)
- New Zealand: Import and Export Prices (Q4)
- China: Caixin Manufacturing PMI (Feb)
- UK: BOE Consumer Credit (Jan)
- US: ISM Manufacturing PMI (Feb)
Tuesday
- Australia: RBA Interest Rate Decision
- EU: Inflation Rate (Feb)
Wednesday
- New Zealand: Building Permits (Jan)
- Global Services PMIs data (Feb Final)
- Australia: GDP data (Q4)
- China: Caixin Services PMI (Feb)
- EU: Retail Sales (Jan)
- BoC Interest Rate Decision
- US ADP Employment Change (Feb)
- US: ISM Non-manufacturing data (Feb)
- US: Fed Beige Book
- Crude Inventories Data
Thursday
- Australia: Trade Balance (Jan)
- BoE: Gov Carney Speech
- BoC: Gov Poloz Speech
Friday
- Canada: Employment Change (Feb)
- US: Non-Farm Payrolls
Saturday
- China: Trade Balance
Chart to Watch: Weekly S&P 500
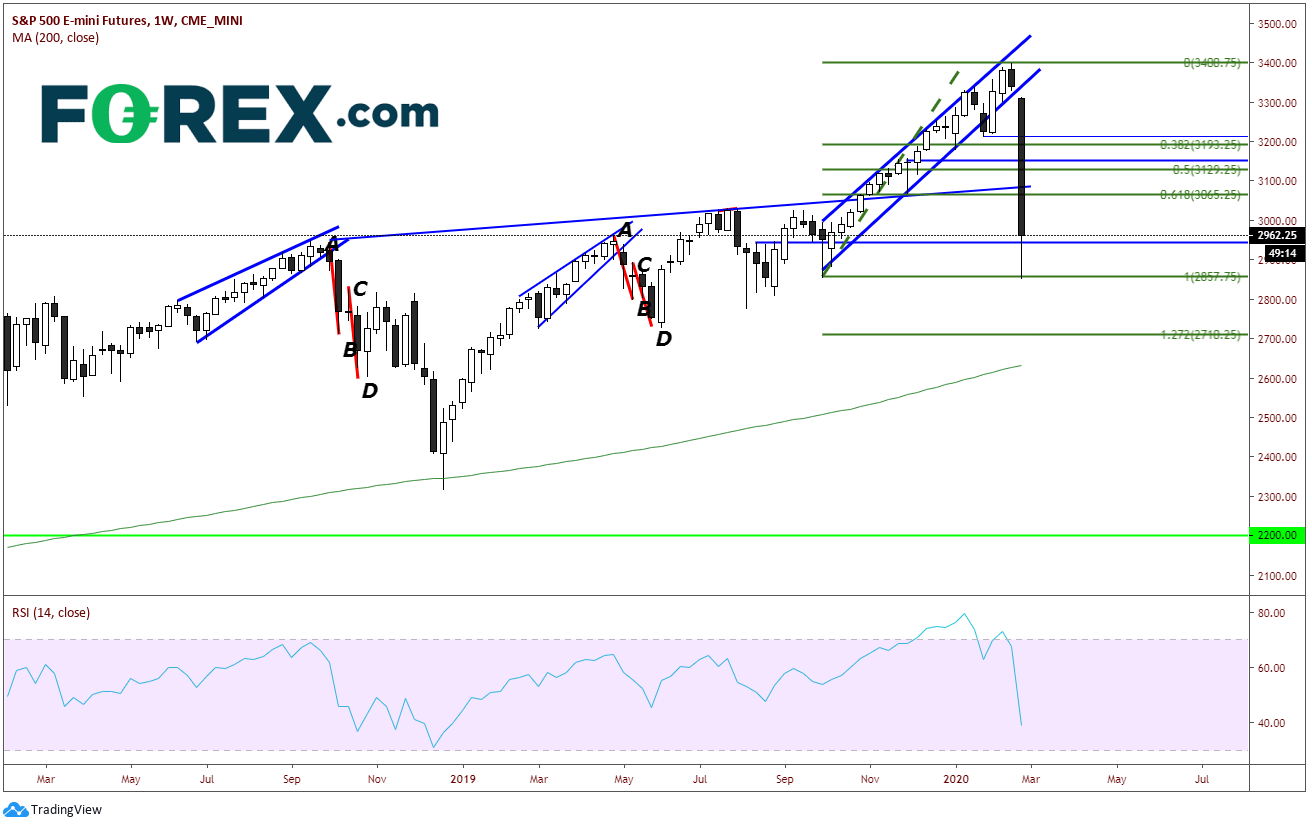
Is there really much to say about this chart? It looks horrible! Price has fallen every day this week and given up 21 weeks of an uptrend. “Up with the Escalator, Down with the Elevator” best describes the price action in this chart. Prices halted at the previously low from the week of September 30th ….for now. This is the largest ever price selloff in the S&P 500 (not in percentage) in one week. Support at today’s lows near 2853.25. The 127% Fibonacci extension from the Sept 30th lows to last weeks high is 2710. There is horizontal support there as well.
Source: Tradingview, CME, FOREX.com
I want to show the daily chart as well. Although we can see how awful price action has been over the last week, take a look at todays “hammer” candlestick. When hammers form at the bottom of and large downtrend, they are often reversal signals (but that doesn’t mean price can’t move towards the lows for the next few days). In addition, notice the RSI on the daily in oversold conditions and turning up. Resistance at the 200 Day Moving Average above near 3050.
Source: Tradingview, CME, FOREX.com
Have a great weekend, stay safe, and make sure to always wash your hands!!
Latest market news




The complete CFD trading experience
Award-winning platforms, competitive spreads, low commissions and dedicated support.
We live and breathe the markets and are dedicated to helping traders realise their ambitions as we continue to set the industry bar.
Economic calendar
Web Trader platform
Our sophisticated web-based platform is packed with features.
Related articles
EUR/USD weekly outlook: Oil, inflation and NFP in focus
After coming under significant pressure in recent weeks, the EUR/USD came off its lows to finish the week on a positive note on Friday, albeit with only a mild rebound. That was not enough to prevent the exchange rate falling for the third consecutive week, as the US dollar and bond yields rallied across the board.

Gold Price Forecast: XAU/USD Avoids Breakdown as Yields Surged but Can it Continue?
Surging Treasury yields sent a jolt across markets last week but, so far, gold prices have held above the FOMC low. The big question now is whether that can continue and, if not, will bulls show up at $4100 or $4k like they did in June and July?

Gold Q4 2026 outlook: Resilience in the face of rallying dollar and yields
As we headed towards the latter stages of Q3 and into Q4, the Fed had just hiked rates in a hawkish FOMC meeting, while the likes of the ECB and BoJ had also tightened their respective policies. Oil prices remained elevated amid the prolonged US-Iran conflict. Meanwhile, bond yields were breaking out, and the dollar was higher across the board. Yet, remarkably, gold was still holding in the positive territory for the third quarter, even if it had weakened somewhat in September.
StoneX Europe Ltd may make third party material available on this website which may contain information included but not limited to the conditions of financial markets. The material is for information purposes only and does not contain, and should not be construed as containing, investment advice and/or investment recommendation and/or an investment research and/or an offer of or solicitation for any transactions in financial instruments; any decision to enter into a specific transaction shall be made by the client following an assessment by him/her of their situation.
StoneX Europe Ltd makes no representation or warranty and assumes no liability as to the accuracy or completeness of the information provided, nor any loss arising from any investment based on a recommendation, forecast or other information supplied. You should always seek independent advice as to your suitability to speculate in any related markets and your ability to assume the associated risks, if you are at all unsure. We are not under any obligation to update any such material. Any opinion made may be personal to the author and may not reflect the opinion of StoneX Europe Ltd.