





ASX 200 Hang Seng Analysis: Bears Shaken Out From Wall Street Surge
Wall Street’s epic rally on Wednesday sparked a strong rebound across Australasian futures markets. The ASX 200 has recouped all of its losses despite being the most volatile week in five years, and Hang Seng futures rebounded from key support levels.
Share this:

View related analysis:
- AUD/USD, Nasdaq Soar as Trump Blinks First, Sparking Epic Market U-Turn
- AUD/USD Analysis: Eyes on China and the yuan Amid Trump’s 104% Tariff
- NZD/USD, AUD/USD Catch Sympathy Bid as RBNZ Play Safe with 25bp Cut
View related analysis:
- AUD/USD, Nasdaq Soar as Trump Blinks First, Sparking Epic Market U-Turn
- AUD/USD Analysis: Eyes on China and the yuan Amid Trump’s 104% Tariff
- NZD/USD, AUD/USD Catch Sympathy Bid as RBNZ Play Safe with 25bp Cut
Wall Street’s epic rally on Wednesday sparked a strong rebound across Australasian futures markets. With the Nasdaq logging its fourth-best day in history—and its second most volatile—the Nikkei was able to reverse mid-week losses of nearly 15% and now sits almost 2% higher from Friday’s close.
ASX 200 futures (SPI 200) have also recouped all early-week losses and are now approximately flat for the week—a win, considering the index’s 10% weekly range puts it on track for its most volatile week in five years.
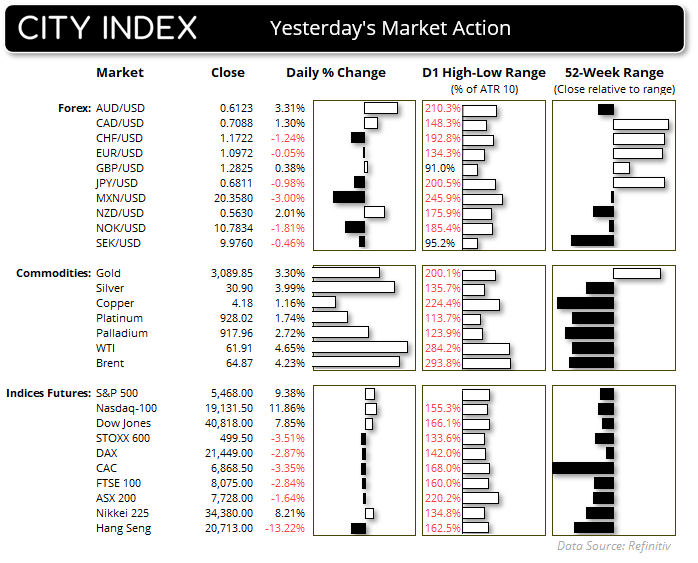
The Hang Seng hasn’t fared quite as well, still nursing weekly losses of around 15% heading into today’s open. However, it had clawed back roughly a quarter of those losses, with a high-to-low range of 20%.
Overall, it has been a stunning turnaround for sentiment, and one that matches the surprise of Trump’s own U-turn.
ASX 200 futures (SPI 200) technical analysis
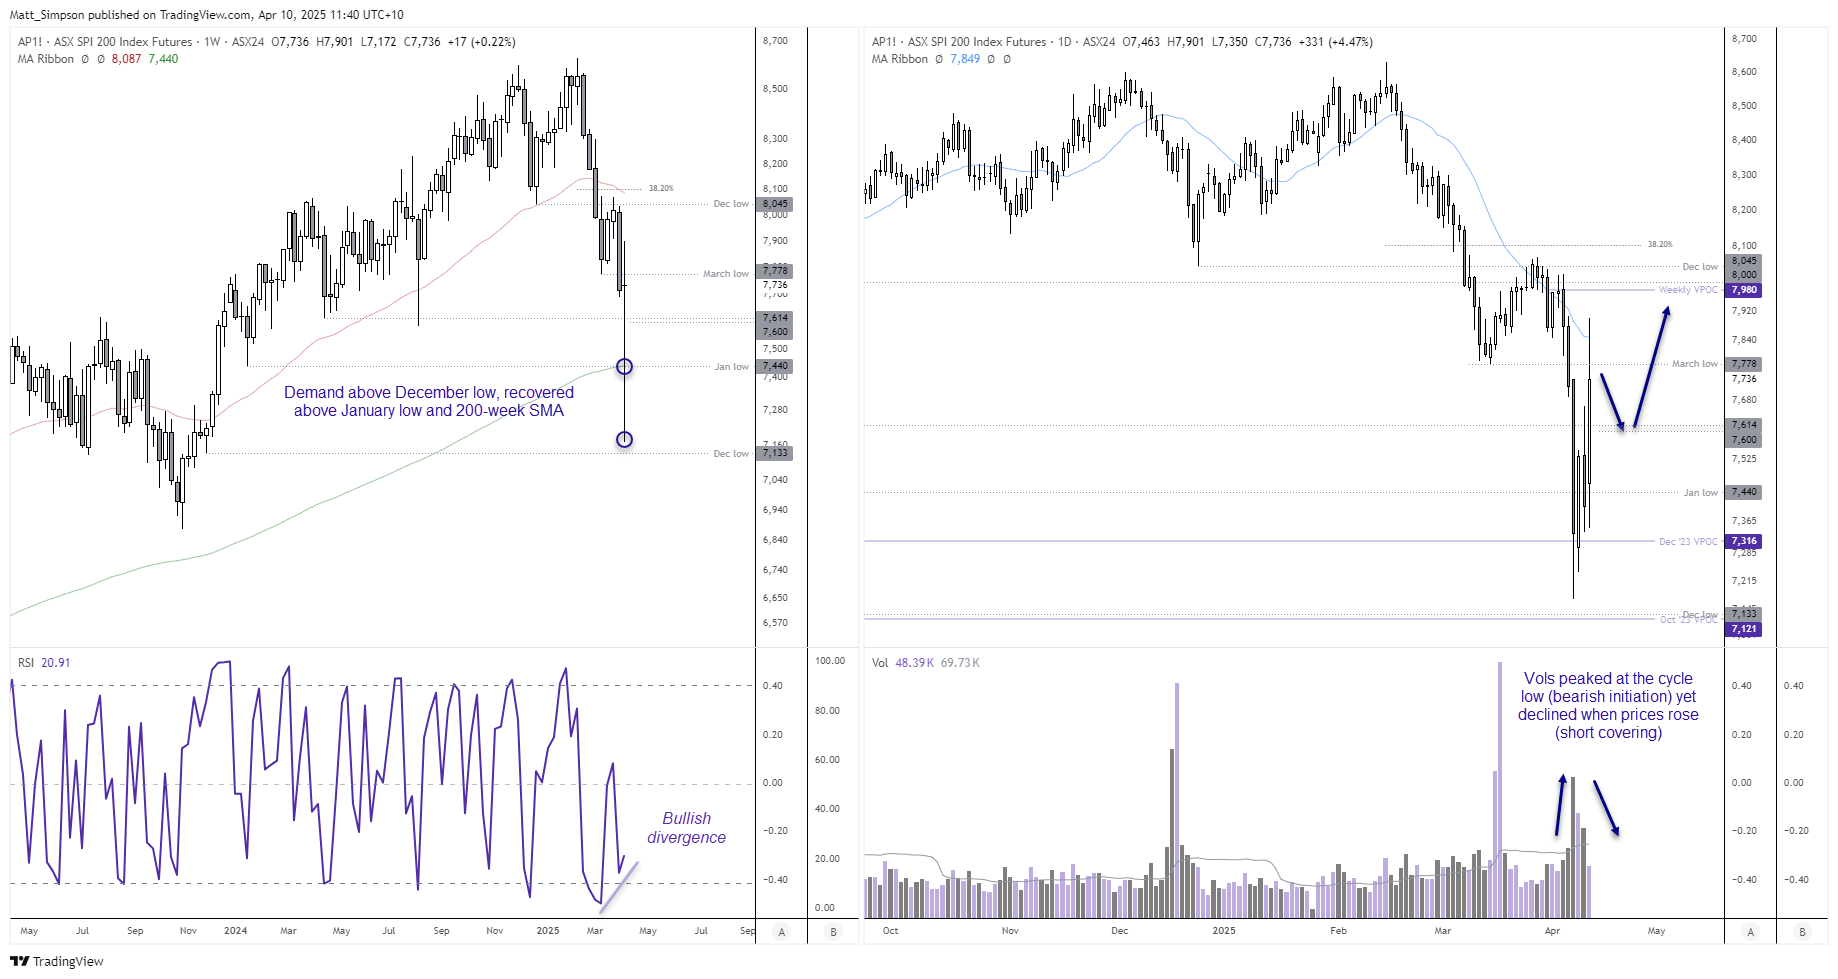
While the ASX 200 sits flat for the week, investors who weathered the volatility may be breathing a sigh of relief. The index is on track to form a bullish pinbar, and assuming volatility remains contained through the week’s close, it seems likely we’ll finish with that pattern intact. The fact that price action held above the December low suggests demand is present at that level, while the recovery above both the 200-week SMA and January low adds conviction that a meaningful bottom may be forming. A bullish divergence is also appearing on the weekly RSI (2).
The daily chart shows the ASX 200 also rallied from the December 2023 VPOC (volume point of control). Yet the rally stalled near the 20-day SMA before closing back below the March low. And since volumes peaked on Monday—the final bearish candle of the recent selloff—and have since declined, the move higher appears to be driven by short-covering.
- I suspect we may see a further retracement before bulls attempt to push toward the 8,000 handle near a weekly VPOC.
- The 7,600 level could offer support ahead of the next leg higher.
Hang Seng futures technical analysis
Like the ASX 200, Hang Seng futures staged a solid rebound from support levels. In this case, the Hang Seng rallied from the 2024 trendline and now trades back above both its 50- and 200-day SMAs. It also managed to close the day above the 20,000 handle, and the market is finding bids again just after the open.
Traders likely have the 21,000 level in their sights now, near the 61.8% Fibonacci retracement. A break above that would bring 21,500 into focus, just beneath the November high.
However, similar to the ASX, daily volumes are declining as prices rise—suggesting the move may be driven by short covering rather than fresh bullish conviction. And with the Hang Seng still the regional underperformer (not helped by Trump’s move to hike tariffs on China to 125%), its upside may remain capped unless Beijing announces fresh stimulus or counters Washington’s latest trade measures.
-- Written by Matt Simpson
Follow Matt on Twitter @cLeverEdge
How to trade with City Index
You can trade with City Index by following these four easy steps:
- Open an account, or log in if you’re already a customer
• Open an account in the UK
• Open an account in Australia
• Open an account in Singapore
- Search for the market you want to trade in our award-winning platform
- Choose your position and size, and your stop and limit levels
- Place the trade
Related tags:



Open an account in minutes
Experience award-winning platforms with fast and secure execution, and enjoy tight spreads from 0.5 pts on FX and 0.3 pts on indices.
Economic calendar
Web Trader platform
Our sophisticated web-based platform is packed with features.
Related articles
Australian Dollar Outlook: AUD/USD Screams Sentiment Extreme Into Fed, CPI
AUD/USD rebounds despite record bearish futures positioning, with Australian Q3 CPI and the Fed meeting threatening to trigger another short squeeze.

EUR/USD weekly outlook: FOMC and ECB to set the tone
The current backdrop is modestly bearish. On Friday, the EUR/USD closed modestly lower, down for the third consecutive day. The pair also posted a weekly decline after staging a modest recovery attempt in the previous week. Out of the past 8 weeks, the EUR/USD has fallen on 6 occasions. There is not much supporting factors for the single currency right now. So, the upside remains capped.


Silver forecast: metals liquidation drags XAG/USD into $50-55 support
Silver has broken its July low and slipped into a long-term support zone as the selling in precious metals deepens. The chart shows where the metal could bottom, and next week's Fed decision may decide whether it does.
This report is intended for general circulation only. It should not be construed as a recommendation, or an offer (or solicitation of an offer) to buy or sell any financial products. The information provided does not take into account your specific investment objectives, financial situation or particular needs. Before you act on any recommendation that may be contained in this report, independent advice ought to be sought from a financial adviser regarding the suitability of the investment product, taking into account your specific investment objectives, financial situation or particular needs.
StoneX Financial Pte. Ltd., may distribute reports produced by its respective foreign entities or affiliates within the StoneX group of companies or third parties pursuant to an arrangement under Regulation 32C of the Financial Advisers Regulations. Where the report is distributed to a person in Singapore who is not an accredited investor, expert investor or an institutional investor (as defined in the Securities Futures Act), StoneX Financial Pte. Ltd. accepts legal responsibility to such persons for the contents of the report only to the extent required by law. Singapore recipients should contact StoneX Financial Pte. Ltd. at 6826 9988 for matters arising from, or in connection with the report.
In the case of all other recipients of this report, to the extent permitted by applicable laws and regulations neither StoneX Financial Pte. Ltd. nor its associated companies will be responsible or liable for any loss or damage incurred arising out of, or in connection with, any use of the information contained in this report and all such liability is hereby expressly disclaimed. No representation or warranty is made, express or implied, that the content of this report is complete or accurate.
StoneX Financial Pte. Ltd. is not under any obligation to update this report.
Trading CFDs carries a high level of risk that may not be suitable for some investors. Consider your investment objectives, level of experience, financial resources, risk appetite and other relevant circumstances carefully. The possibility exists that you could lose some or all of your investments, including your initial deposits. If in doubt, please seek independent expert advice. Visit www.forex.com/en-sg/terms-and-policies for the complete Risk Disclosure Statement.