



ASX 200 Market Outlook: Can Santa’s Rally Help the ASX This December?
ASX 200 heads into December with seasonality on its side, but key support levels must hold for a Santa rally to emerge.
Share this:

The ASX 200 has finally broken its four-week losing streak, but momentum has already started to fade. With December’s strong seasonality now in play, traders are weighing whether a Santa rally can override weakening technicals and falling sector breadth. Key levels now determine whether the Australian share market can stabilise into mid-month or risk slipping into a deeper correction.
View related analysis:
View related analysis:
ASX 200 December Outlook
ASX 200 Market Snapshot
- The Australian share market snapped a four-week losing streak on Friday, with the ASX 200 gaining 2.8% and recovering most of the prior week’s losses.
- Momentum faded quickly though, with a small-range shooting star and doji cluster before prices reversed lower on Monday and closed back below the 200-day EMA.
- Eight of eleven ASX 200 sectors fell, led by Health Care (XHJ -1.65%), Information Technology (XIJ -1.3%), and Communication Services (XTJ -1.1%).
- Financials (XFJ) extended its decline for a second day after breaking down from the bear-flag structure highlighted last week, finishing at a six-month low.
- ANZ led the big four banks lower, also trading out of a bear flag, while CBA is testing a potential break beneath the 150 level.
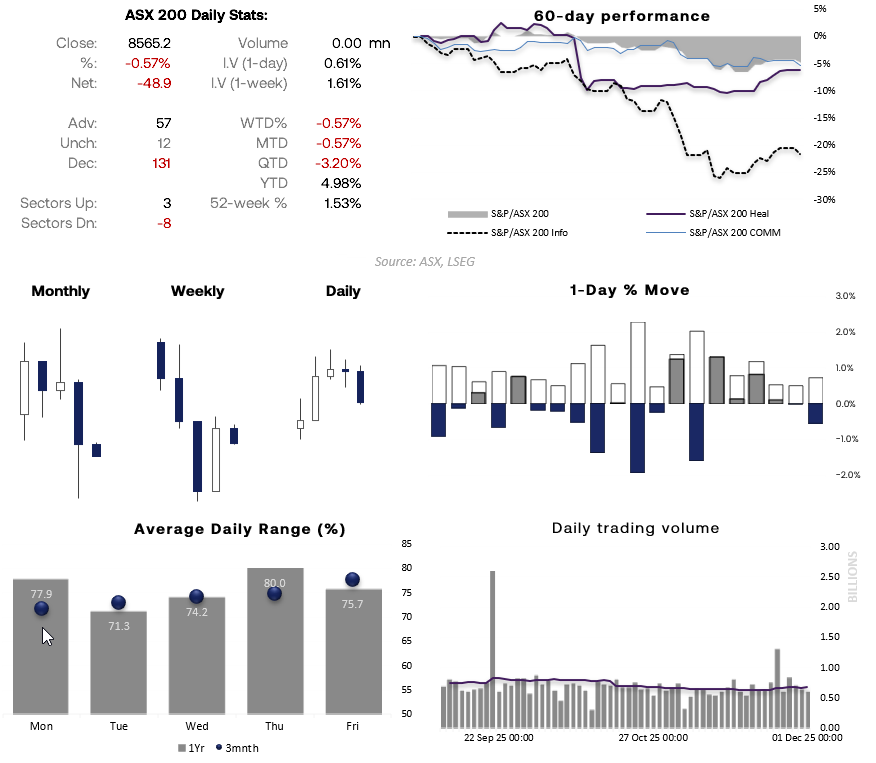
Chart analysis by Matt Simpson - source: ASX, LSEG


ASX 200 Seasonality
December is typically associated with equity gains thanks to positive leads from Wall Street. Interestingly, the ASX 200 has actually outperformed the Nasdaq 100 during this period.
- The ASX 200 has delivered an average December return of 1.86%, with a 1.8% median, showing the gains are consistent rather than skewed by outliers.
- December also boasts the highest win rate of the year at 72.7%.
- However, the average high-to-low monthly volatility is relatively modest at 5.7%.
- Volatility lifts to 6.1% in January, but both average and median returns drop to 0.25% and 0.7% respectively.
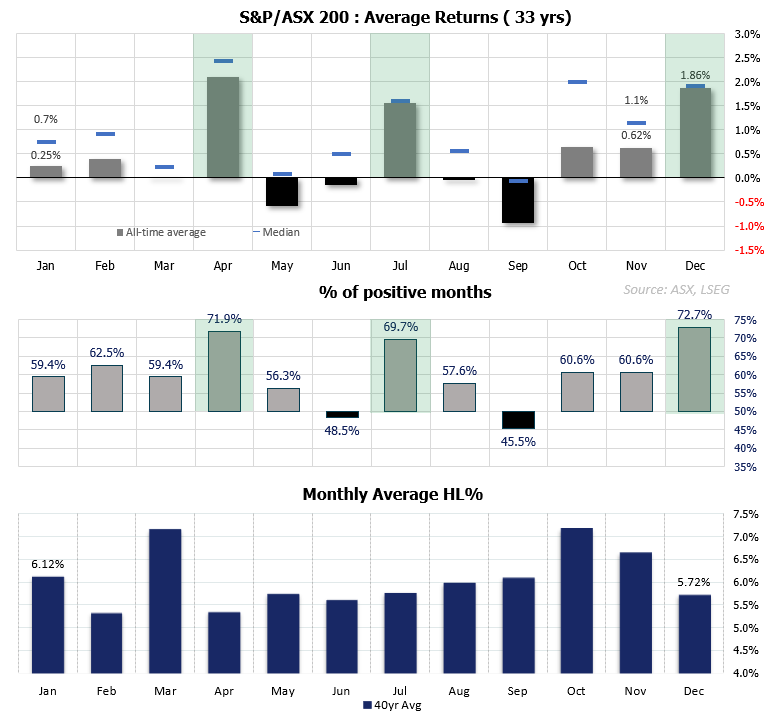
Chart analysis by Matt Simpson - source: ASX, LSEG
ASX 200 December Seasonality
We can take a closer look at how the ASX performs within December by analysing daily average returns for the month. While such a close look is prone to noise, a couple of interesting patterns emerge.
- The ASX 200 consistently shows a bullish bias from 16–24 December.
- This is backed by a positive win rate from 17–24 December.
- The positive return and win rate on 25 December is an artefact of pre-2000 data rather than actual trading, as the ASX is closed on Christmas Day.
- Overall, traders tend to be most bullish in the two weeks leading into Christmas Eve.
- The final trading day of the month is negative around 60% of the time, though the average decline is small.
- Near-term behaviour also aligns with the data: 2–3 December show bullish tendencies, while 4 December and 10 December lean negative.
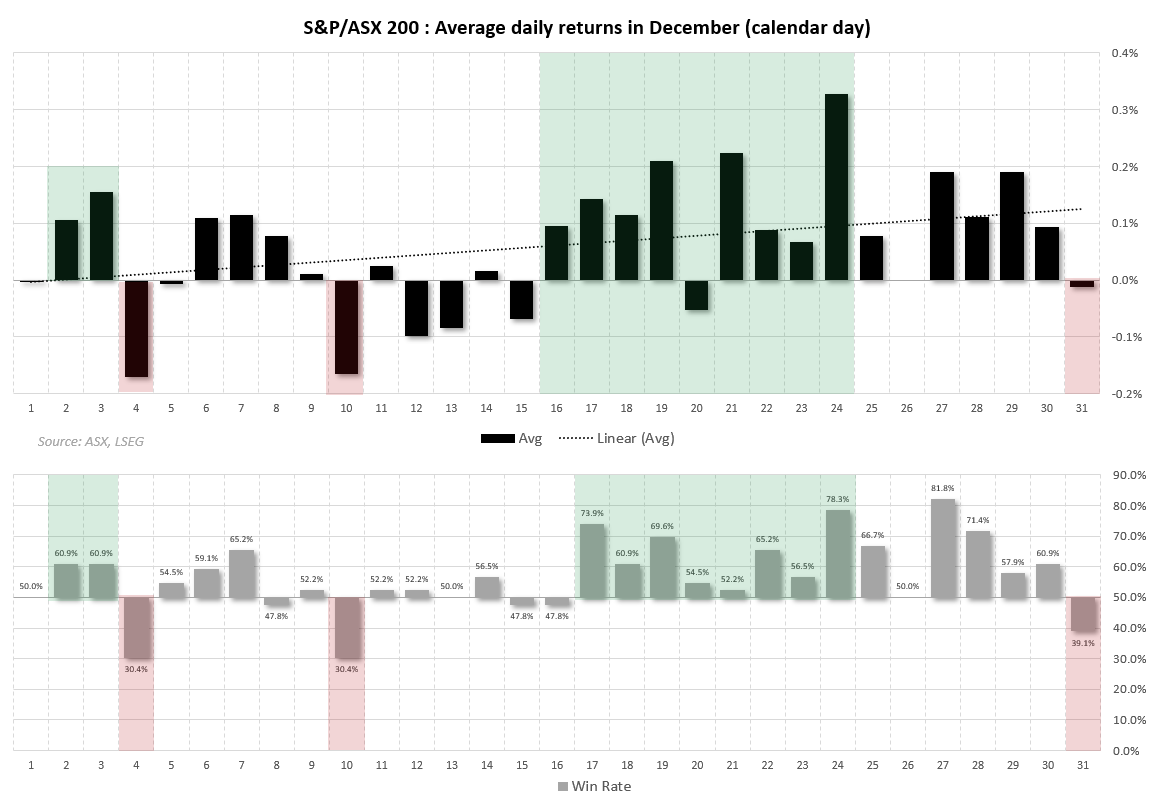
Chart analysis by Matt Simpson - source: ASX, LSEG


ASX 200 Futures (SPI 200) Technical Analysis
The weekly chart shows a bullish piercing pattern after a four-week selloff found support at the long-term 38.2% Fibonacci retracement. This keeps the 8400 region pivotal for sentiment: a break below it would imply a far deeper correction for the Australian share market.
Seasonality does lean supportive into mid-December, but traders should remain flexible.
On the daily chart, momentum has rolled over again, and the 200-day EMA has capped recent upside attempts. Prices are trying to stabilise above the August low, with the 200-day SMA nearby at 8457 to offer potential support.
I suspect bears will continue probing the downside, but may find it difficult to force a clean break below 8500 in the near term. If the ASX can stay supported into 16 December, the odds of a pre-Christmas Santa rally increase, opening scope for a move towards 8750–8800.
However, the seasonal tailwind fades quickly if momentum turns sharply lower again and the index breaks beneath 8400, which would align with the broader decline from its record high.
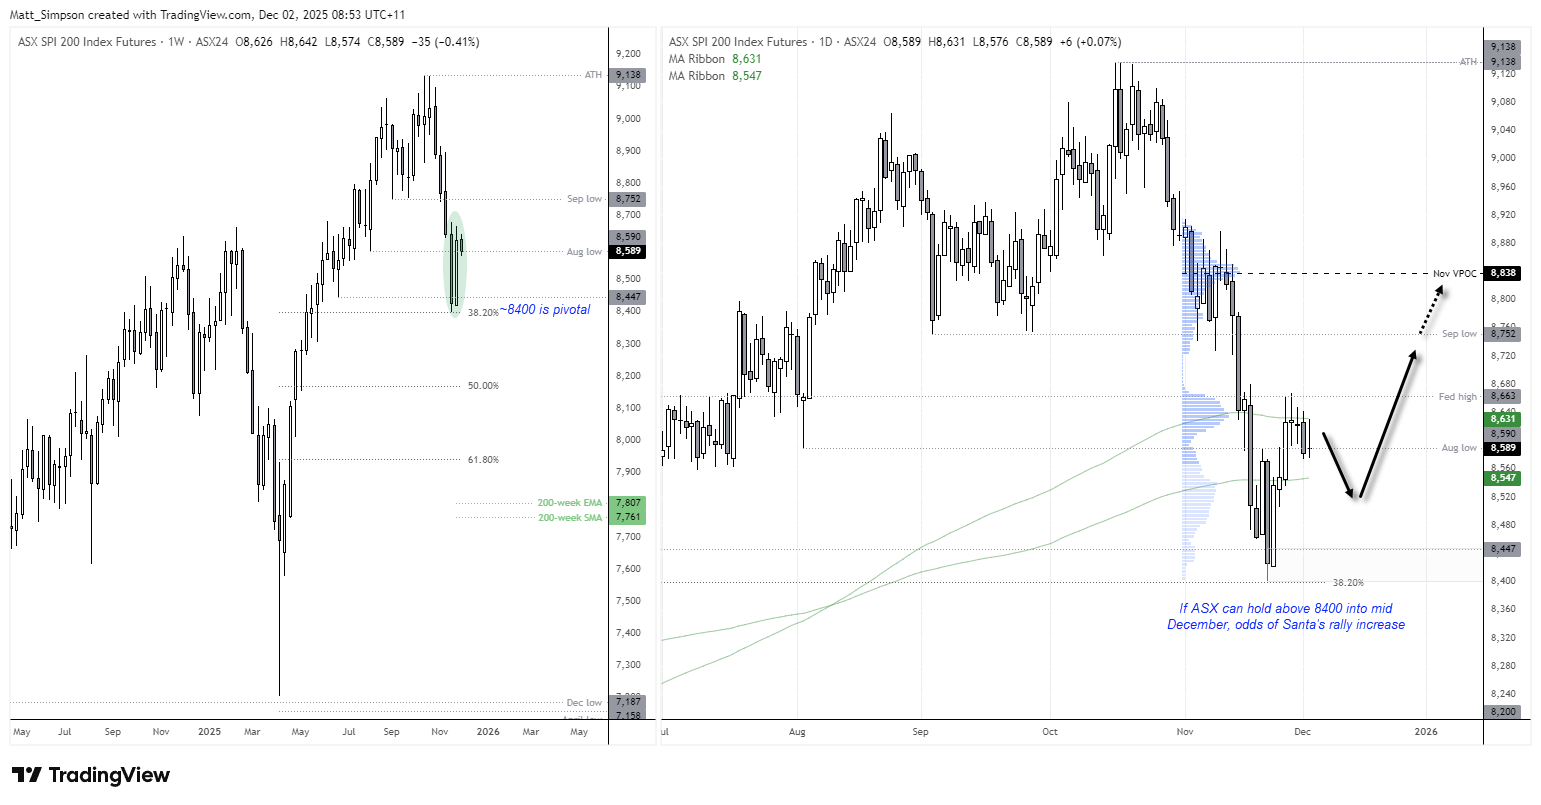
Chart analysis by Matt Simpson - Source: TradingView, ASX SPI 200 Index Futures
View the full economic calendar
View the full economic calendar
-- Written by Matt Simpson
Follow Matt on Twitter @cLeverEdge
How to trade with City Index
You can trade with City Index by following these four easy steps:
- Open an account, or log in if you’re already a customer
• Open an account in the UK
• Open an account in Australia
• Open an account in Singapore
- Search for the market you want to trade in our award-winning platform
- Choose your position and size, and your stop and limit levels
- Place the trade
Related tags:



Open an account in minutes
Experience award-winning platforms with fast and secure execution, and enjoy tight spreads from 0.5 pts on FX and 0.3 pts on indices.
Economic calendar
Web Trader platform
Our sophisticated web-based platform is packed with features.
Related articles

USD/JPY and USD/CHF Could Diverge as CHF/JPY Approaches Resistance
USD/JPY and USD/CHF retain bullish structures, but CHF/JPY resistance could expose a divergence between the two US dollar pairs.

ASX 200 Rebound Stalls Despite Wall Street Surge
The ASX 200 rebound is struggling for traction despite a powerful Wall Street rally, leaving 8800 resistance and downside risks in focus.

Nikkei threatens breakout as tech rebound broadens
Breakouts across the SOX and Nasdaq are being matched by rebounds across Asia, with the Nikkei now threatening to join the move.

This report is intended for general circulation only. It should not be construed as a recommendation, or an offer (or solicitation of an offer) to buy or sell any financial products. The information provided does not take into account your specific investment objectives, financial situation or particular needs. Before you act on any recommendation that may be contained in this report, independent advice ought to be sought from a financial adviser regarding the suitability of the investment product, taking into account your specific investment objectives, financial situation or particular needs.
StoneX Financial Pte. Ltd., may distribute reports produced by its respective foreign entities or affiliates within the StoneX group of companies or third parties pursuant to an arrangement under Regulation 32C of the Financial Advisers Regulations. Where the report is distributed to a person in Singapore who is not an accredited investor, expert investor or an institutional investor (as defined in the Securities Futures Act), StoneX Financial Pte. Ltd. accepts legal responsibility to such persons for the contents of the report only to the extent required by law. Singapore recipients should contact StoneX Financial Pte. Ltd. at 6826 9988 for matters arising from, or in connection with the report.
In the case of all other recipients of this report, to the extent permitted by applicable laws and regulations neither StoneX Financial Pte. Ltd. nor its associated companies will be responsible or liable for any loss or damage incurred arising out of, or in connection with, any use of the information contained in this report and all such liability is hereby expressly disclaimed. No representation or warranty is made, express or implied, that the content of this report is complete or accurate.
StoneX Financial Pte. Ltd. is not under any obligation to update this report.
Trading CFDs carries a high level of risk that may not be suitable for some investors. Consider your investment objectives, level of experience, financial resources, risk appetite and other relevant circumstances carefully. The possibility exists that you could lose some or all of your investments, including your initial deposits. If in doubt, please seek independent expert advice. Visit www.forex.com/en-sg/terms-and-policies for the complete Risk Disclosure Statement.