


ASX 200 Market Outlook: Grinds Higher, but Momentum Still Fragile
ASX 200 steadies near 8600 as a bounce builds, but fragile momentum and FOMC risk leave bulls needing a clear catalyst.
Share this:

The ASX 200 is attempting to stabilise after snapping a three-day losing streak, with price action holding near the 8600 options cluster. While a modest bounce is building, momentum remains fragile and heavily dependent on macro drivers. With the FOMC meeting looming, traders appear reluctant to commit, leaving the index grinding higher within a tight range rather than breaking into a sustained trend.
View related analysis:
View related analysis:
ASX 200 Edges Higher, but Momentum Remains Fragile
ASX 200 Market Snapshot
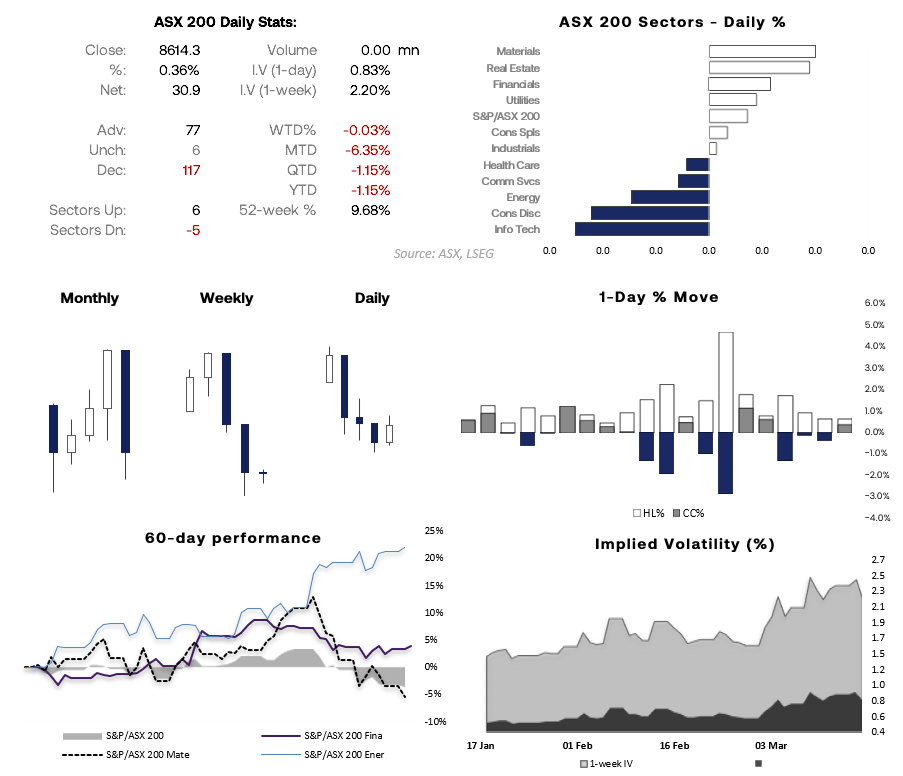
- Momentum turned slightly higher on Tuesday, with the ASX 200 snapping a three-day losing streak despite the 25bp hike from the RBA
- SPI 200 (ASX 200 futures) were also higher overnight, suggesting bullish momentum is slowly building
- 6 of the 11 ASX sectors advanced, led by materials (XMJ) and real estate (XRE), while 5 declined, led by technology (XIJ) and consumer discretionary (XDJ)
- Commonwealth Bank (CBA), Westpac (WBC) and ANZ announced they will raise home loan rates by 25bp
- Macquarie (MQG) pulls back from Kuwait oil pipeline deal amid Iran tensions
- Xero (XRO) partners with Xendoo as demand rises from QuickBooks users
- BHP advances Chile copper expansion and begins approvals process
- CSL flags global supply shortage of key gene therapy treatment
Source: ASX, LSEG
ASX 200 Correlation Analysis
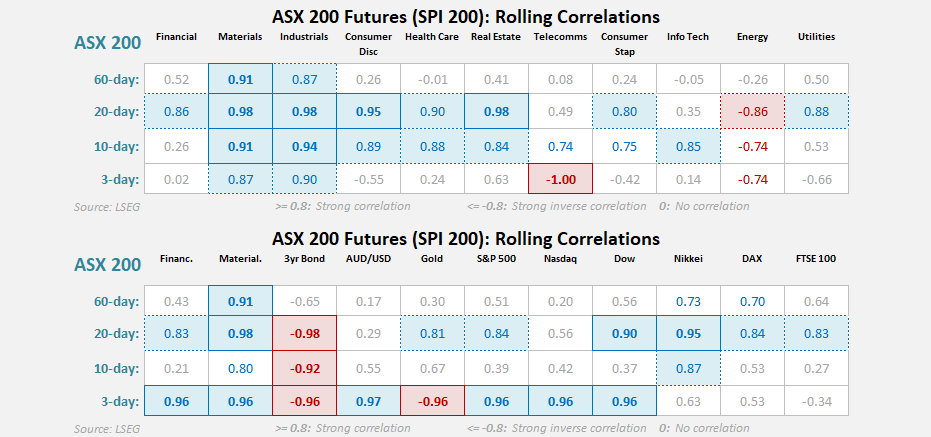
- Correlations show the ASX 200 remains tightly linked to materials and financials, with strong positive relationships across most timeframes — no surprise given their heavy index weighting
- Energy has flipped to a strong inverse correlation over the short term, suggesting oil’s surge is not translating into broader equity support (yet)
- US indices (S&P 500, Nasdaq, Dow) are highly correlated on a 20-day basis, reinforcing that Wall Street remains the key directional driver for the ASX
- The sharp inverse correlation with bonds (3yr) highlights rates as a dominant macro force — higher yields continue to weigh on equities
- Short-term (3-day) correlations are unstable, with some extreme readings (0.96), signalling choppy, event-driven conditions rather than a clean trend
The ASX 200 is still trading as a macro proxy — led by global equities, sensitive to yields, and increasingly disconnected from energy.
Source: ASX, ASX24, TradingView


ASX 200 Technical Analysis
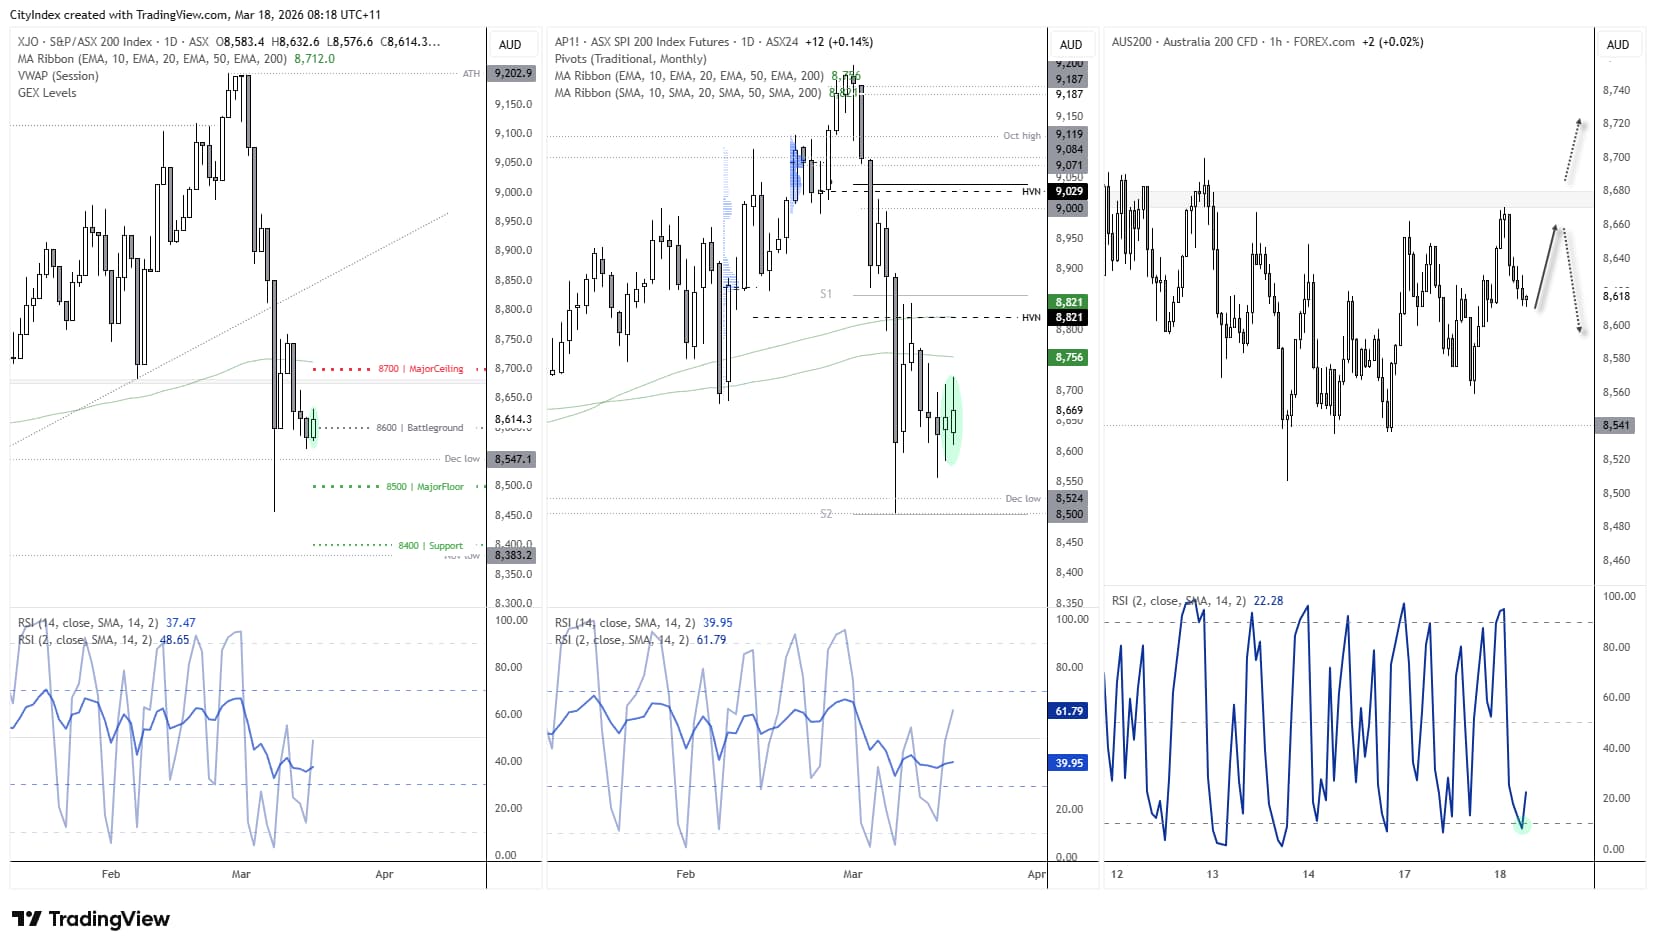
The ASX 200 continues to show potential for at least a minor bounce, though traders may want to remain nimble as daily ranges are currently subdued heading into the FOMC meeting.
- The ASX daily cash market (left) shows prices remain anchored to the 8600 options cluster, while the small bullish candle hints at a near-term swing low
- The SPI 200 futures (middle chart) show the combined cash and overnight session closed with a bullish upside day, again suggesting the market is trying to grind higher
- The 1-hour chart (right) shows the market is effectively ranging between 8450–8600, with prices drifting higher within the range. The 1-hour RSI (2) reached oversold to hint at a swing low, so bulls may gain traction early in the session. Without a fresh catalyst, bears may be lurking around yesterday’s highs, leaving the ASX at risk of rolling back into the range unless a breakout occurs
Source: ASX, ASX24, TradingView
View the full economic calendar
View the full economic calendar
-- Written by Matt Simpson
Follow Matt on Twitter @cLeverEdge
How to trade with City Index
You can trade with City Index by following these four easy steps:
- Open an account, or log in if you’re already a customer
• Open an account in the UK
• Open an account in Australia
• Open an account in Singapore
- Search for the market you want to trade in our award-winning platform
- Choose your position and size, and your stop and limit levels
- Place the trade
Related tags:



Open an account in minutes
Experience award-winning platforms with fast and secure execution, and enjoy tight spreads from 0.5 pts on FX and 0.3 pts on indices.
Economic calendar
Web Trader platform
Our sophisticated web-based platform is packed with features.
Related articles
Australian Dollar Outlook: AUD/USD Screams Sentiment Extreme Into Fed, CPI
AUD/USD rebounds despite record bearish futures positioning, with Australian Q3 CPI and the Fed meeting threatening to trigger another short squeeze.

EUR/USD weekly outlook: FOMC and ECB to set the tone
The current backdrop is modestly bearish. On Friday, the EUR/USD closed modestly lower, down for the third consecutive day. The pair also posted a weekly decline after staging a modest recovery attempt in the previous week. Out of the past 8 weeks, the EUR/USD has fallen on 6 occasions. There is not much supporting factors for the single currency right now. So, the upside remains capped.


Silver forecast: metals liquidation drags XAG/USD into $50-55 support
Silver has broken its July low and slipped into a long-term support zone as the selling in precious metals deepens. The chart shows where the metal could bottom, and next week's Fed decision may decide whether it does.
This report is intended for general circulation only. It should not be construed as a recommendation, or an offer (or solicitation of an offer) to buy or sell any financial products. The information provided does not take into account your specific investment objectives, financial situation or particular needs. Before you act on any recommendation that may be contained in this report, independent advice ought to be sought from a financial adviser regarding the suitability of the investment product, taking into account your specific investment objectives, financial situation or particular needs.
StoneX Financial Pte. Ltd., may distribute reports produced by its respective foreign entities or affiliates within the StoneX group of companies or third parties pursuant to an arrangement under Regulation 32C of the Financial Advisers Regulations. Where the report is distributed to a person in Singapore who is not an accredited investor, expert investor or an institutional investor (as defined in the Securities Futures Act), StoneX Financial Pte. Ltd. accepts legal responsibility to such persons for the contents of the report only to the extent required by law. Singapore recipients should contact StoneX Financial Pte. Ltd. at 6826 9988 for matters arising from, or in connection with the report.
In the case of all other recipients of this report, to the extent permitted by applicable laws and regulations neither StoneX Financial Pte. Ltd. nor its associated companies will be responsible or liable for any loss or damage incurred arising out of, or in connection with, any use of the information contained in this report and all such liability is hereby expressly disclaimed. No representation or warranty is made, express or implied, that the content of this report is complete or accurate.
StoneX Financial Pte. Ltd. is not under any obligation to update this report.
Trading CFDs carries a high level of risk that may not be suitable for some investors. Consider your investment objectives, level of experience, financial resources, risk appetite and other relevant circumstances carefully. The possibility exists that you could lose some or all of your investments, including your initial deposits. If in doubt, please seek independent expert advice. Visit www.forex.com/en-sg/terms-and-policies for the complete Risk Disclosure Statement.