


ASX 200 Market Outlook: Record High Faces Key Options Pivot
ASX 200 hits a record high, but 9,125 gamma could decide the next move. Break higher or rotate back towards 9,000?
Share this:
The ASX 200 closed at a fresh record high despite renewed bets of an RBA hike, as investors focused on a resilient domestic economy and strong banking profits. A 1.2% gain marked the index’s best session in two weeks and left a Morning Star reversal pattern on the daily chart.
But while momentum remains constructive, options positioning suggests 9,125 could prove decisive in the near term.
View related analysis:
View related analysis:
ASX 200 Tests 9,125 as Record Rally Meets Gamma Resistance
ASX 200 Market Snapshot
- The ASX 200 cash index closed at a record high on Wednesday despite renewed bets of an RBA hike, as equity traders focused on a resilient economy and strong banking profits.
- Its 1.2% gain marked the best session in two weeks and left a Morning Star pattern (three-bar bullish reversal) on the daily chart at record highs.
- Materials (XMJ) led eight sectors higher as cyclical and mining stocks outperformed, while financials (XFJ) and technology (XIJ) also enjoyed a risk-on session.
- A strong earnings beat from Woolworths (WOW) saw the stock surge 13%, helping the consumer staples sector (XSJ) post its best day in six years with a 5.7% gain.
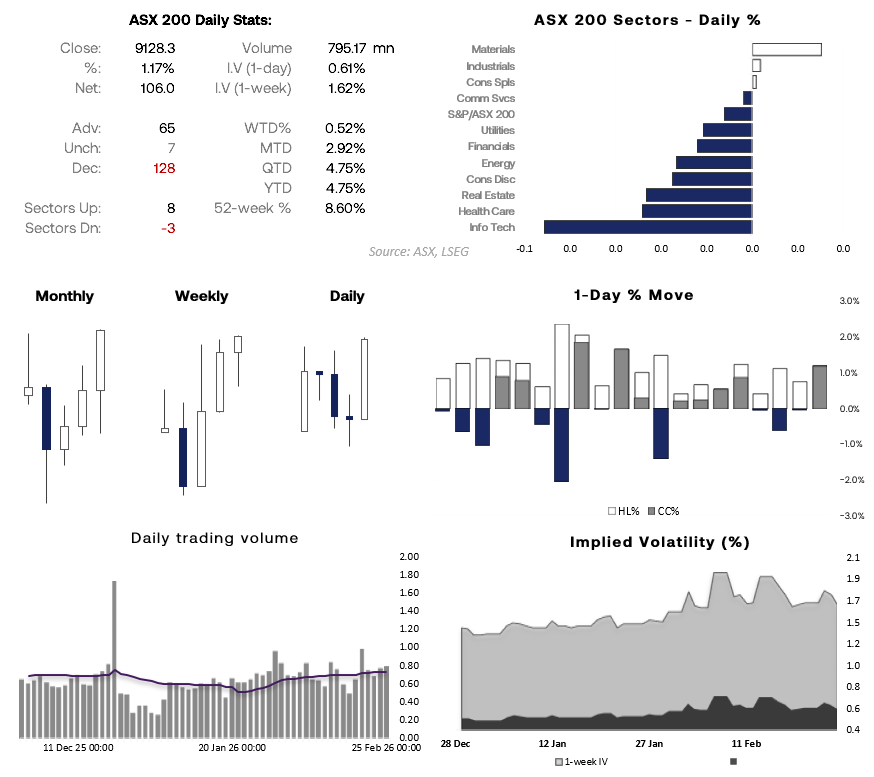
Source: ASX, LSEG


ASX 200 Technical Analysis
ASX 200 Options Positioning: 9,125 the Pivot as Gamma Clusters Tighten
ASX 200 gamma is tightly clustered between 9,100 and 9,125 for today’s expiry, which puts the index squarely in a dealer hedging zone. That typically promotes chop rather than clean trends.
- 9,125 is the key pivot — acceptance above it could open the door to 9,150 and potentially 9,175 next week.
- But if price slips back below 9,125, expect rotation toward 9,100 and possibly 9,000.
- In short, this is a break-and-hold market, not a chase-and-hope one.
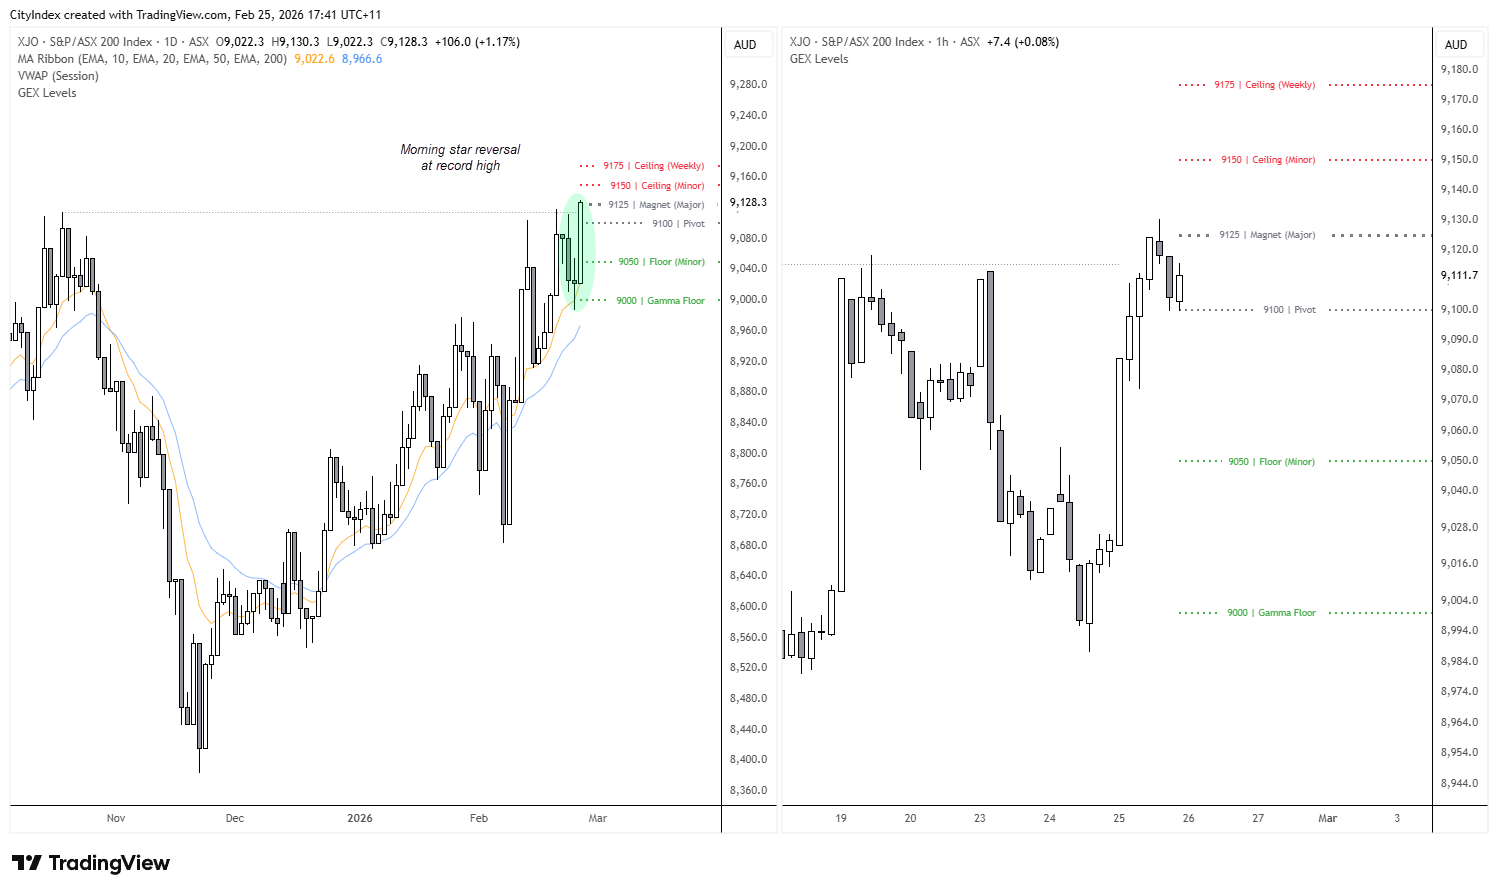
Source: ASX, TradingView
Indices


SPI 200 (ASX 200 Futures) Outlook
While Australia’s share market has reached a record high, the ASX 200 futures market has not. It needs to rise another 0.44% to test its all-time high set in October — and if it does, it could also stall the rally on the ASX 200 cash index.
With the ASX 200 cash market stalling around an important options cluster at 9,125, there is potential for a pullback in the futures market overnight. The 1-hour chart suggests a possible double top forming around 9,080, alongside a bearish divergence. I am not looking for a deep retracement given the strong close on the cash market, though we could see prices rotate towards 9,050 near the high-volume node (HVN).
It could be argued that prices are overextended from the weekly VPOC, but I see this more as a reference point for bulls to buy dips rather than a reason alone to seek shorts. Overall, it seems more likely than not that ASX 200 futures will attempt another run at a record high — pullback or not.
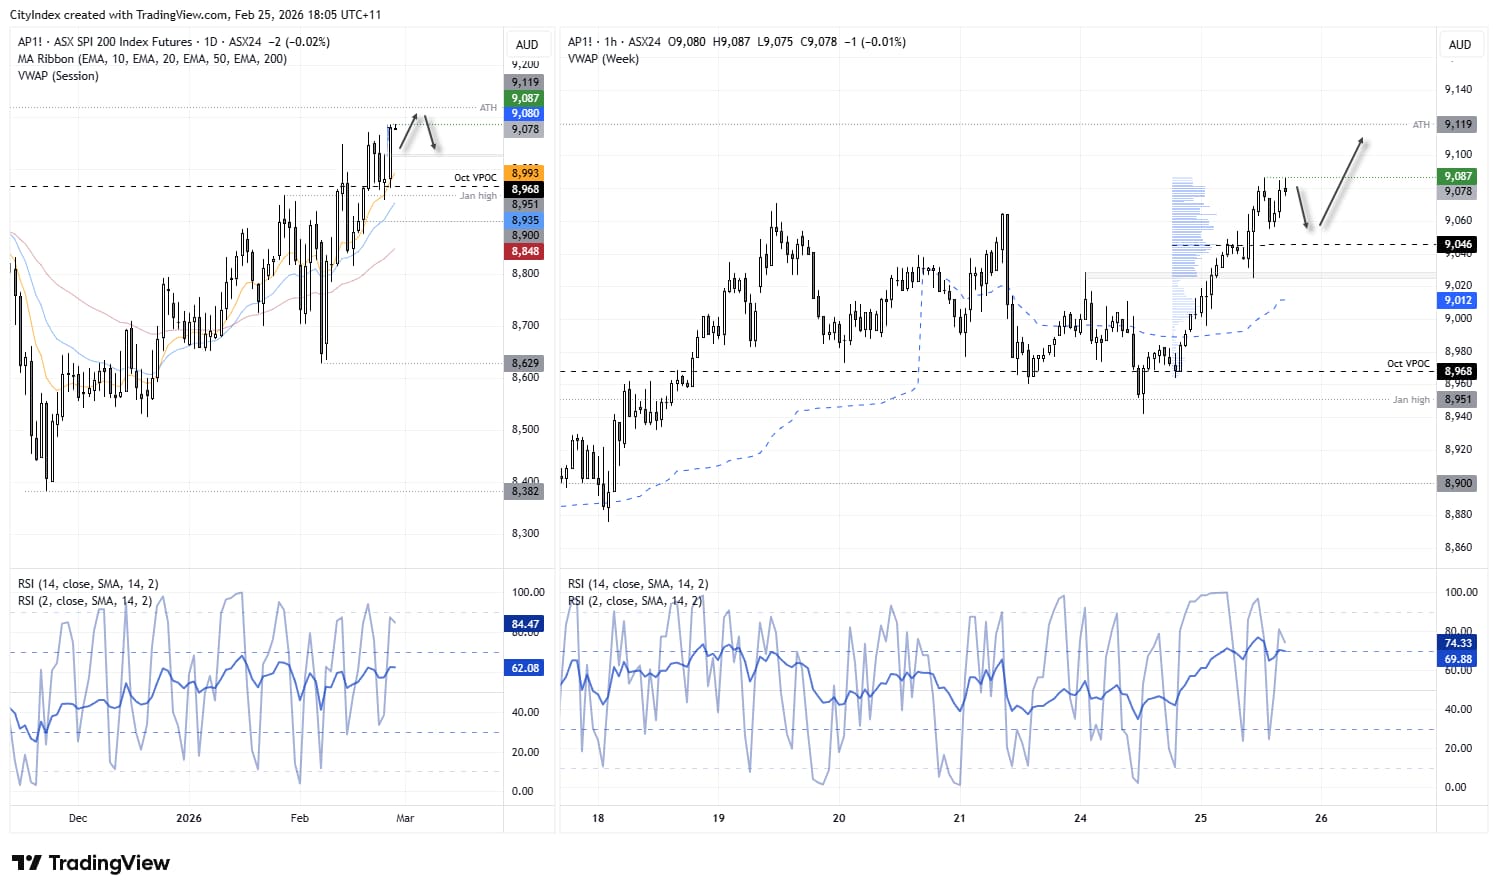
Source: ASX, TradingView
View the full economic calendar
View the full economic calendar
-- Written by Matt Simpson
Follow Matt on Twitter @cLeverEdge
How to trade with City Index
You can trade with City Index by following these four easy steps:
- Open an account, or log in if you’re already a customer
• Open an account in the UK
• Open an account in Australia
• Open an account in Singapore
- Search for the market you want to trade in our award-winning platform
- Choose your position and size, and your stop and limit levels
- Place the trade
Related tags:



Open an account in minutes
Experience award-winning platforms with fast and secure execution, and enjoy tight spreads from 0.5 pts on FX and 0.3 pts on indices.
Economic calendar
Web Trader platform
Our sophisticated web-based platform is packed with features.
Related articles
Australian Dollar Outlook: AUD/USD Screams Sentiment Extreme Into Fed, CPI
AUD/USD rebounds despite record bearish futures positioning, with Australian Q3 CPI and the Fed meeting threatening to trigger another short squeeze.

EUR/USD weekly outlook: FOMC and ECB to set the tone
The current backdrop is modestly bearish. On Friday, the EUR/USD closed modestly lower, down for the third consecutive day. The pair also posted a weekly decline after staging a modest recovery attempt in the previous week. Out of the past 8 weeks, the EUR/USD has fallen on 6 occasions. There is not much supporting factors for the single currency right now. So, the upside remains capped.


Silver forecast: metals liquidation drags XAG/USD into $50-55 support
Silver has broken its July low and slipped into a long-term support zone as the selling in precious metals deepens. The chart shows where the metal could bottom, and next week's Fed decision may decide whether it does.
This report is intended for general circulation only. It should not be construed as a recommendation, or an offer (or solicitation of an offer) to buy or sell any financial products. The information provided does not take into account your specific investment objectives, financial situation or particular needs. Before you act on any recommendation that may be contained in this report, independent advice ought to be sought from a financial adviser regarding the suitability of the investment product, taking into account your specific investment objectives, financial situation or particular needs.
StoneX Financial Pte. Ltd., may distribute reports produced by its respective foreign entities or affiliates within the StoneX group of companies or third parties pursuant to an arrangement under Regulation 32C of the Financial Advisers Regulations. Where the report is distributed to a person in Singapore who is not an accredited investor, expert investor or an institutional investor (as defined in the Securities Futures Act), StoneX Financial Pte. Ltd. accepts legal responsibility to such persons for the contents of the report only to the extent required by law. Singapore recipients should contact StoneX Financial Pte. Ltd. at 6826 9988 for matters arising from, or in connection with the report.
In the case of all other recipients of this report, to the extent permitted by applicable laws and regulations neither StoneX Financial Pte. Ltd. nor its associated companies will be responsible or liable for any loss or damage incurred arising out of, or in connection with, any use of the information contained in this report and all such liability is hereby expressly disclaimed. No representation or warranty is made, express or implied, that the content of this report is complete or accurate.
StoneX Financial Pte. Ltd. is not under any obligation to update this report.
Trading CFDs carries a high level of risk that may not be suitable for some investors. Consider your investment objectives, level of experience, financial resources, risk appetite and other relevant circumstances carefully. The possibility exists that you could lose some or all of your investments, including your initial deposits. If in doubt, please seek independent expert advice. Visit www.forex.com/en-sg/terms-and-policies for the complete Risk Disclosure Statement.