



ASX 200 Morning Market Outlook: Bulls Hesitate Near Record Highs
ASX 200 nears record highs but shows hesitation with a shooting star candle, low volume, and mixed sector performance hinting at near-term caution.
Share this:

The ASX 200 reached a 30-day high on Monday, coming within 28 points of its all-time peak from late August. However, momentum stalled as a shooting star candle signalled hesitation near record territory. Despite five sectors advancing, overall volume remained subdued for a second session — hinting that traders may be waiting for stronger conviction before driving the next breakout.
View related analysis:
View related analysis:
ASX 200 Near Record Highs but Bulls Show Caution
ASX 200 Market Snapshot
- The ASX 200 reached a 30-day high on Monday, with the daily high reaching just 28 points (0.3%) below its record peak from 25 August.
- Five of eleven sectors advanced, led by Materials (+0.6%) and Utilities (+0.4%), while Real Estate was flat (+0.02%).
- Six sectors declined, with Information Technology (-1.4%) and Healthcare (-0.9%) leading losses.
- A small shooting star candle formed on the daily chart, signalling hesitation among bulls near record highs.
- Trading volumes were below average and lower for a second consecutive session, suggesting reduced confidence in the short-term rally.

Chart analysis by Matt Simpson - data source: ASX, LSEG
ASX 200 Sector Performance
Technology remains the standout performer, up 33.6% over the past six months. However, momentum is shifting toward Materials (+21.2%), which are now matching Energy (+22.5%) as the most resilient cyclical sectors. I continue to suspect Energy may have formed at least a short-term base after its recent pullback from year-to-date highs.
Only Healthcare (-1.35%) and Consumer Staples (-4.8%) have declined during this period, highlighting that overall ASX 200 sector breadth remains supportive of the broader index.

Chart analysis by Matt Simpson - data source: ASX, LSEG


ASX 200 Futures Intraday Levels
The ASX 200 futures are consolidating within Monday’s shooting star candle, just below the record high. While the RSI (14) continues to trend higher without entering overbought territory, suggesting the broader uptrend remains intact, short-term hesitation may lead to choppy trade or a minor pullback before another attempt higher.
On the 1-hour chart, the 9,000 area aligns with the monthly R1 pivot, creating a potential support zone for dip buyers. A break below this could expose the 8,939–8,950 region, defined by the September high and monthly pivot.
To the upside, 9,100 remains a logical target for bulls, positioned between the weekly R1 and monthly R2 pivots.
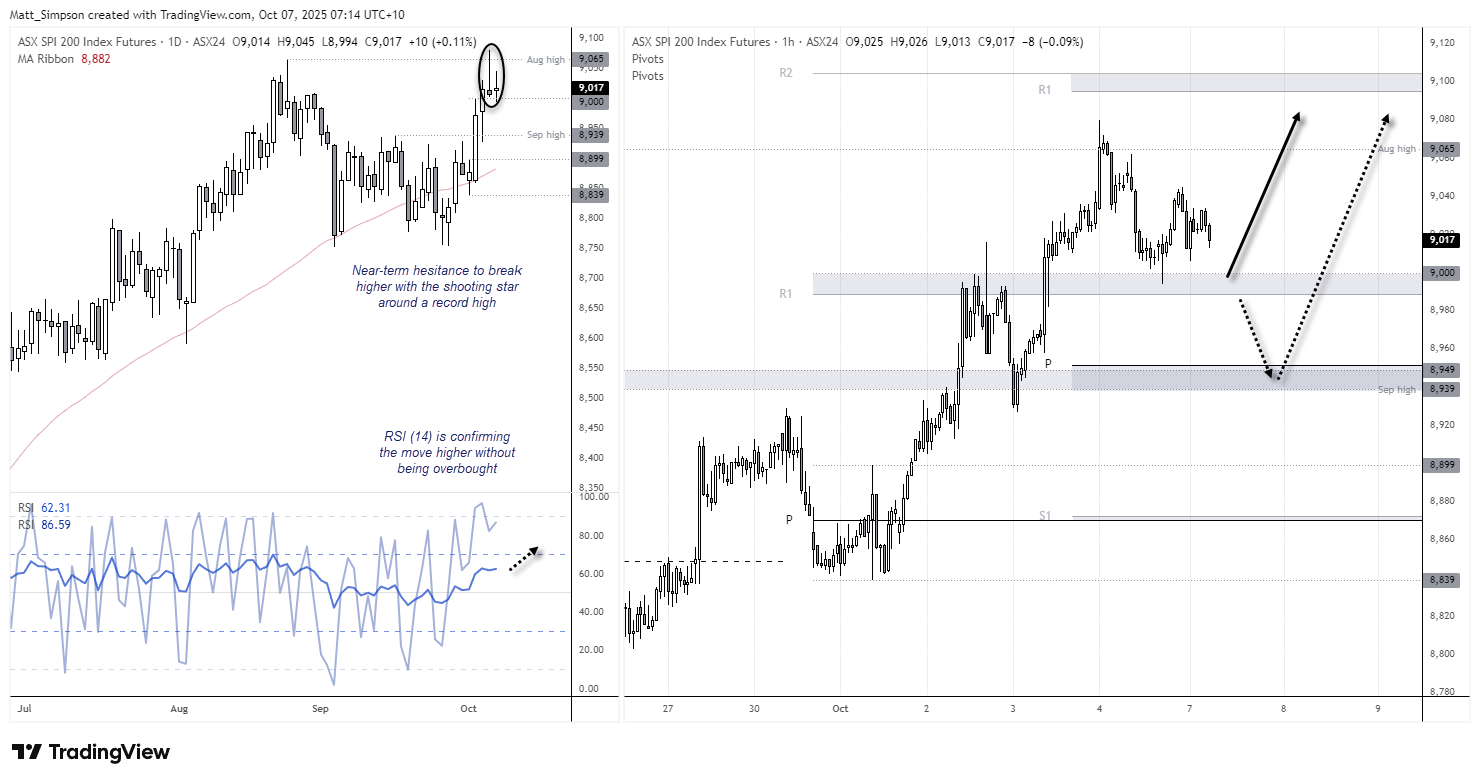
Chart analysis by Matt Simpson - Source: TradingView, ASX SPI 200 Index Futures
View the full economic calendar
View the full economic calendar
-- Written by Matt Simpson
Follow Matt on Twitter @cLeverEdge
How to trade with City Index
You can trade with City Index by following these four easy steps:
- Open an account, or log in if you’re already a customer
• Open an account in the UK
• Open an account in Australia
• Open an account in Singapore
- Search for the market you want to trade in our award-winning platform
- Choose your position and size, and your stop and limit levels
- Place the trade
Related tags:




Open an account in minutes
Experience award-winning platforms with fast and secure execution, and enjoy tight spreads from 0.5 pts on FX and 0.3 pts on indices.
Economic calendar
Web Trader platform
Our sophisticated web-based platform is packed with features.
Related articles

Japanese Yen Surges Across FX Majors as Risk Aversion Intensifies
Safe-haven demand sent the Japanese yen higher across FX majors, while USD/JPY broke lower ahead of Japan's CPI release and next week's BOJ meeting.

AUD/USD Bears Denied a Big, Bearish Breakout via Hawkish RBA, Weak USD
AUD/USD defies a potential head-and-shoulders breakdown as RBA rate hike bets surge and a weaker US dollar fuels an Australian dollar rally.

British Pound Rallies into CPI as BoE Hike Bets Firm - GBP/USD, GBP/AUD
Sterling rallies ahead of UK inflation as BoE hike bets firm. GBP/USD tests resistance while GBP/AUD forms a potential bullish reversal.
This report is intended for general circulation only. It should not be construed as a recommendation, or an offer (or solicitation of an offer) to buy or sell any financial products. The information provided does not take into account your specific investment objectives, financial situation or particular needs. Before you act on any recommendation that may be contained in this report, independent advice ought to be sought from a financial adviser regarding the suitability of the investment product, taking into account your specific investment objectives, financial situation or particular needs.
StoneX Financial Pte. Ltd., may distribute reports produced by its respective foreign entities or affiliates within the StoneX group of companies or third parties pursuant to an arrangement under Regulation 32C of the Financial Advisers Regulations. Where the report is distributed to a person in Singapore who is not an accredited investor, expert investor or an institutional investor (as defined in the Securities Futures Act), StoneX Financial Pte. Ltd. accepts legal responsibility to such persons for the contents of the report only to the extent required by law. Singapore recipients should contact StoneX Financial Pte. Ltd. at 6826 9988 for matters arising from, or in connection with the report.
In the case of all other recipients of this report, to the extent permitted by applicable laws and regulations neither StoneX Financial Pte. Ltd. nor its associated companies will be responsible or liable for any loss or damage incurred arising out of, or in connection with, any use of the information contained in this report and all such liability is hereby expressly disclaimed. No representation or warranty is made, express or implied, that the content of this report is complete or accurate.
StoneX Financial Pte. Ltd. is not under any obligation to update this report.
Trading CFDs carries a high level of risk that may not be suitable for some investors. Consider your investment objectives, level of experience, financial resources, risk appetite and other relevant circumstances carefully. The possibility exists that you could lose some or all of your investments, including your initial deposits. If in doubt, please seek independent expert advice. Visit www.forex.com/en-sg/terms-and-policies for the complete Risk Disclosure Statement.