


ASX 200 Morning Market Outlook: Bulls Lack Wall Street's Pace
The ASX 200 edged higher, led by tech and energy, but continues to lag Wall Street despite upbeat US–China trade headlines.
Share this:

The ASX 200 extended its cautious advance on Monday, with nine of eleven sectors higher led by Technology, Energy, and Financials. However, overall breadth was soft, and price action remains choppy. Despite record highs on Wall Street and improving US–China trade sentiment, the local benchmark continues to underperform — leaving bears tempted to fade weak rallies in anticipation of another pullback.
View related analysis:
View related analysis:
ASX 200 Struggles to Match Wall Street’s Strength
ASX 200 Market Snapshot
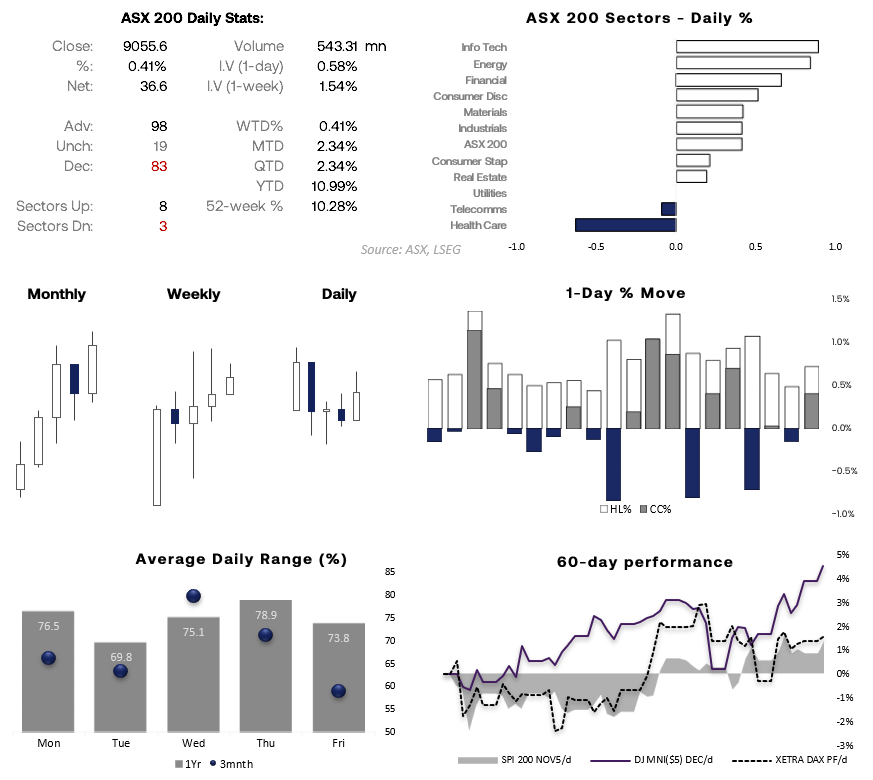
Chart analysis by Matt Simpson - source: ASX, LSEG
- While the ASX 200 closed higher on Monday, only 98 stocks advanced (49%), 83 declined (41.5%), and 19 were unchanged (9.5%).
- Still, 9 of the 11 ASX sectors advanced, led by Technology (XIJ), Energy (XEJ), and Financials (XFJ).
- Price action remains choppy on the daily timeframe, with Monday’s cautious gains forming in the upper wick of a spinning-top doji.
- The ASX 200 continues to lag its Wall Street counterparts, with the Dow Jones and S&P 500 outperforming the local market over the past 60 days.
- Without a fresh catalyst, bears may look to fade into such weak rallies on expectations of another dip lower for the ASX — which remains unresponsive to record highs on Wall Street despite positive US–China trade headlines.
ASX 200 Sector Analysis
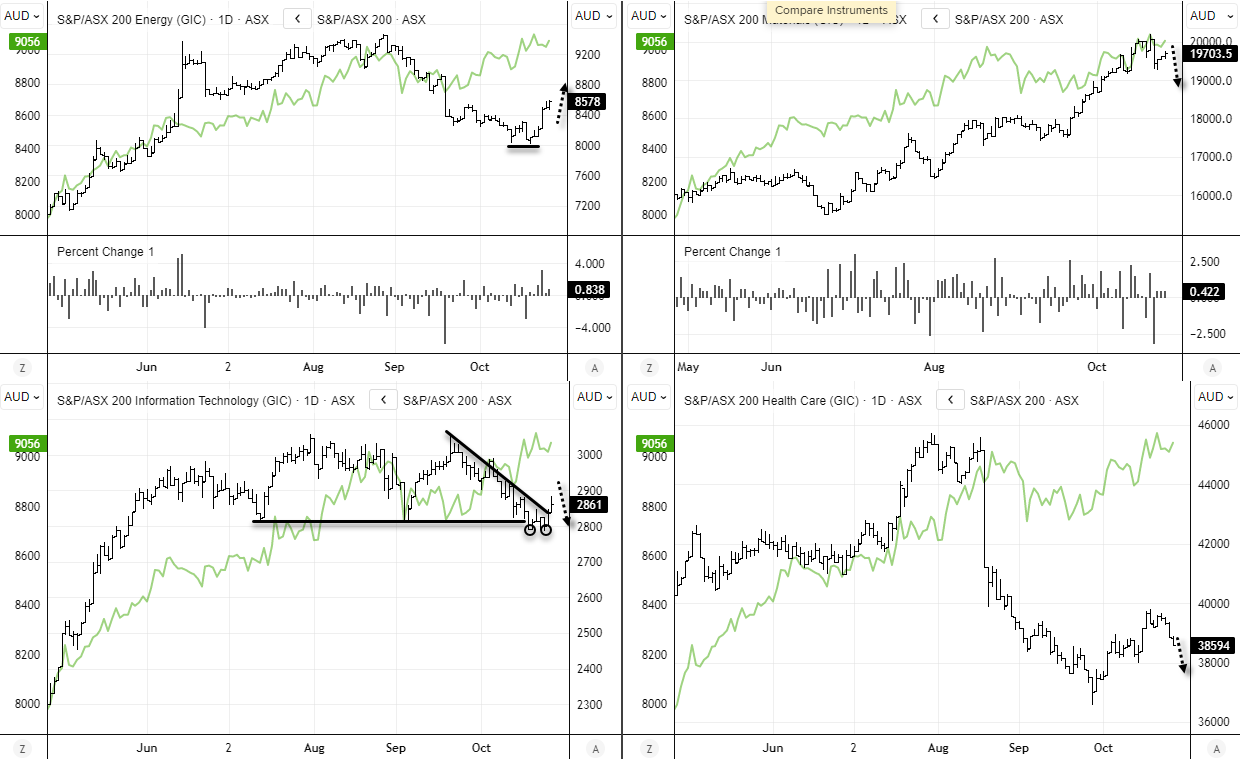
Chart analysis by Matt Simpson - source: ASX, LSEG
AXS 200 Energy (XEJ)
The ASX 200 Energy sector (XEJ) has enjoyed a solid six-day rally, supported by a rebound in crude oil prices. Woodside Energy (WDS) has climbed 12.3% over this period; however, with crude prices turning lower on Monday, I question how much further upside remains for both Woodside and the broader sector.
While the energy sector may lose some bullish momentum in the near term, the sharp reversal of the past week suggests further gains could follow after a minor correction.
ASX 200 Materials (XMJ)
The Materials sector rose for a third day on Monday but has yet to recover even half of last Wednesday’s steep decline. Given that the fall came from record highs and marked the sector’s worst session in six months, I suspect at least one more leg lower may follow once this minor bullish retracement completes.
- Fortescue (FMG) reached my bullish triangle target near $21 on Friday, but closed the day with a two-bar bearish reversal pattern (dark cloud cover). Monday’s small bullish inside day suggests a potential short-term pullback.
- BHP Group (BHP) continues to struggle near its September 2024 high — a resistance level it failed to break last week.
- Rio Tinto (RIO) is the outlier, continuing to edge higher despite broader sector weakness.


ASX 200 Information Technology (XIJ)
The Information Technology sector looks bullish in the near term, having formed a double bottom around 2800 alongside a false break of the July and September lows. Monday’s bullish session also saw the sector break a descending trendline, suggesting buyers may retain control for now.
However, I’m not yet convinced this sector is ready to push to new highs. Wisetech (WTC) and Xero (XRO) remain in firm uptrends, and for now, attempts to reverse those trends appear weak. As the two largest constituents by market capitalisation, I’ll be watching for signs of a swing high once the current rally runs its course.
ASX 200 Health Care (XHJ)
Care (XHJ) fell for a fourth straight session on Monday, marking an eight-day low. Given the reversal followed a three-wave move higher, I’m left wondering whether the rally from the September low to the October high was merely corrective — and whether the sector is now in trouble.
- CSL Ltd (CSL) has seen rising bearish volume throughout its recent decline and remains a bellwether for the sector.
- Sigma Healthcare (SIG) has traded sideways for most of the year, and last week’s range expansion has since fizzled beneath the September high.
- Pro Medicus (PME) peaked in July, with momentum drifting lower since — another sign of internal weakness within the broader sector.


ASX 200 Futures (SPI 200) Technical Analysis
The daily chart shows ASX 200 futures are coiling, with a series of converging highs and lows over the past two weeks. While this doesn’t necessarily signal the direction of the next move, it does suggest that a burst of volatility is imminent.
Prices are currently hugging the 10-day EMA and Thursday’s VPOC (volume point of control). With momentum turning lower on Monday, bears may look to fade into minor rallies within the range, anticipating a bearish breakout and potential retest of the 9,000 handle — near the 20-day EMA.
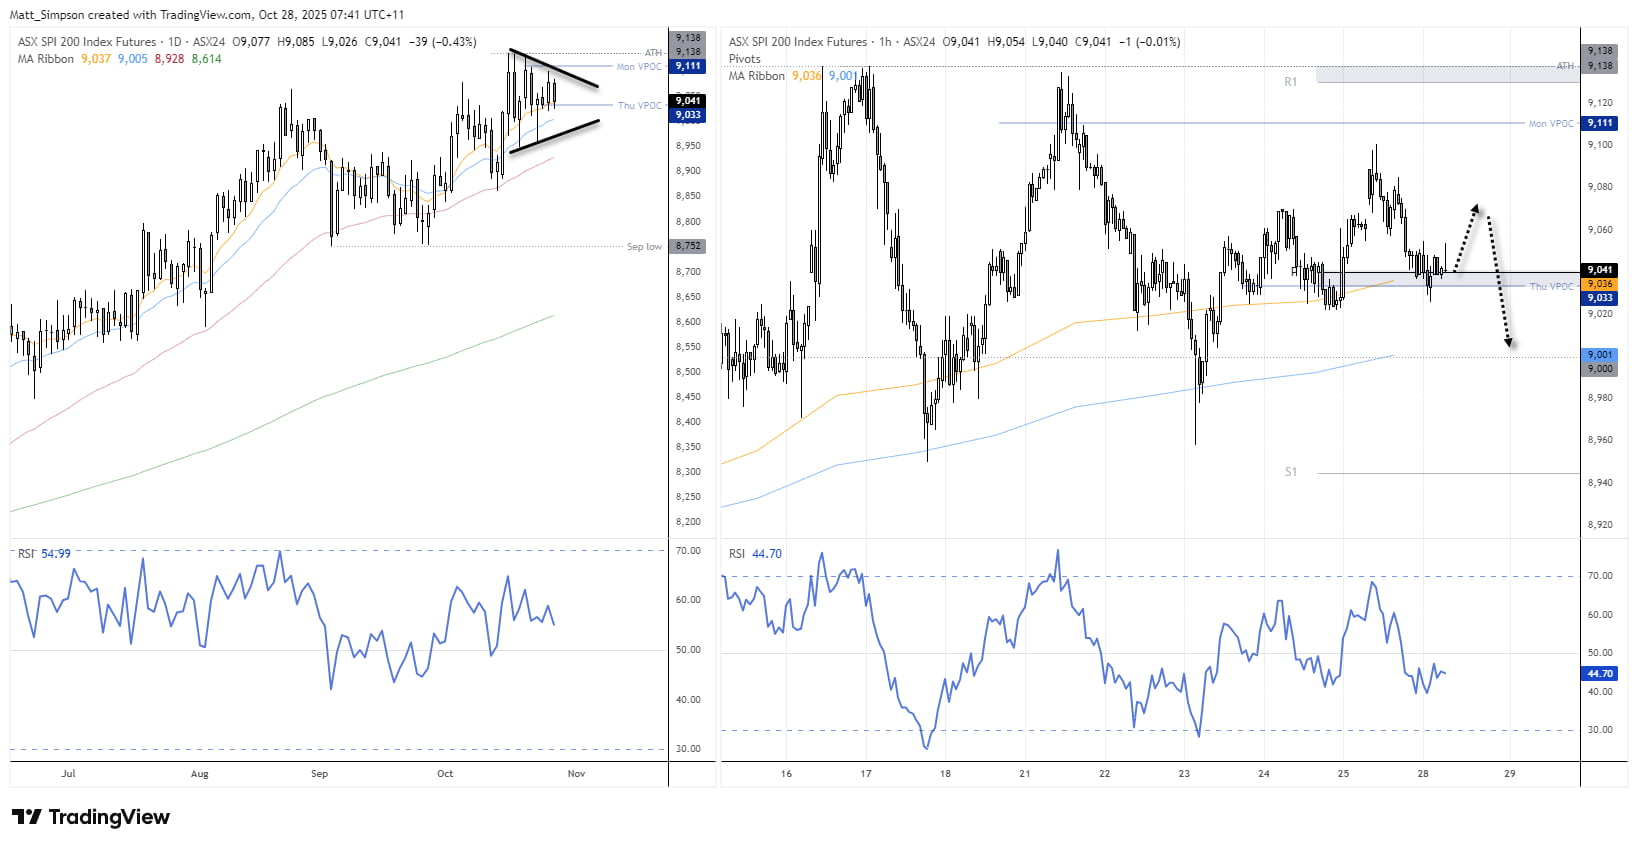
Chart analysis by Matt Simpson - Source: TradingView, ASX SPI 200 Index Futures
View the full economic calendar
View the full economic calendar
-- Written by Matt Simpson
Follow Matt on Twitter @cLeverEdge
How to trade with City Index
You can trade with City Index by following these four easy steps:
- Open an account, or log in if you’re already a customer
• Open an account in the UK
• Open an account in Australia
• Open an account in Singapore
- Search for the market you want to trade in our award-winning platform
- Choose your position and size, and your stop and limit levels
- Place the trade
Related tags:




Open an account in minutes
Experience award-winning platforms with fast and secure execution, and enjoy tight spreads from 0.5 pts on FX and 0.3 pts on indices.
Economic calendar
Web Trader platform
Our sophisticated web-based platform is packed with features.
Related articles
Australian Dollar Outlook: AUD/USD Screams Sentiment Extreme Into Fed, CPI
AUD/USD rebounds despite record bearish futures positioning, with Australian Q3 CPI and the Fed meeting threatening to trigger another short squeeze.

S&P 500 forecast: AI linked stocks remain under pressure
And just like that, it is Friday again and the end of a volatile week. Today offers little on the macro calendar to change the prevailing narrative, leaving markets largely at the mercy of risk appetite, oil prices and the growing unease around the AI trade.


USD/JPY, Nikkei Break Lower as AI Meltdown Spreads
Thursday’s tech tantrum has become Friday’s fire sale. With Nikkei support giving way and the yen strengthening, could the selling start feeding on itself?

This report is intended for general circulation only. It should not be construed as a recommendation, or an offer (or solicitation of an offer) to buy or sell any financial products. The information provided does not take into account your specific investment objectives, financial situation or particular needs. Before you act on any recommendation that may be contained in this report, independent advice ought to be sought from a financial adviser regarding the suitability of the investment product, taking into account your specific investment objectives, financial situation or particular needs.
StoneX Financial Pte. Ltd., may distribute reports produced by its respective foreign entities or affiliates within the StoneX group of companies or third parties pursuant to an arrangement under Regulation 32C of the Financial Advisers Regulations. Where the report is distributed to a person in Singapore who is not an accredited investor, expert investor or an institutional investor (as defined in the Securities Futures Act), StoneX Financial Pte. Ltd. accepts legal responsibility to such persons for the contents of the report only to the extent required by law. Singapore recipients should contact StoneX Financial Pte. Ltd. at 6826 9988 for matters arising from, or in connection with the report.
In the case of all other recipients of this report, to the extent permitted by applicable laws and regulations neither StoneX Financial Pte. Ltd. nor its associated companies will be responsible or liable for any loss or damage incurred arising out of, or in connection with, any use of the information contained in this report and all such liability is hereby expressly disclaimed. No representation or warranty is made, express or implied, that the content of this report is complete or accurate.
StoneX Financial Pte. Ltd. is not under any obligation to update this report.
Trading CFDs carries a high level of risk that may not be suitable for some investors. Consider your investment objectives, level of experience, financial resources, risk appetite and other relevant circumstances carefully. The possibility exists that you could lose some or all of your investments, including your initial deposits. If in doubt, please seek independent expert advice. Visit www.forex.com/en-sg/terms-and-policies for the complete Risk Disclosure Statement.