


Australian Dollar Outlook: AUD/USD Eyes Volatility Ahead of Fed, AU CPI
AUD/USD traders brace for volatility as the Fed’s policy decision, Australia’s CPI report, and US–China trade talks dominate the week ahead.
Share this:

The Australian dollar faces a potentially volatile week, with traders preparing for major catalysts including the Federal Reserve’s policy decision, Australia’s quarterly inflation report, and renewed US–China trade discussions. With RBA rate-cut expectations building and global sentiment uncertain, AUD/USD could see sharp moves in both directions.
View related analysis:
AUD/USD Set for Volatile Week Ahead of Fed Decision and Australian CPI
US inflation data on Friday came in slightly softer than expected across the board, paving the way for the Fed to continue cutting rates. Fed funds futures implied a 98.3% chance of a 25bp cut next week and a 91.1% probability of another in December. A third successive cut is currently priced at around 50% for either the January, March, or April meetings.
The US dollar index initially dropped around 1% after the data release but regained ground by the close, ahead of US–China trade talks over the weekend in Kuala Lumpur, Malaysia. How those talks unfold could very much set the tone for the Trump–Xi summit, currently scheduled for 30 October in South Korea. Unless the negotiating wheels fall off and talks get cancelled. Either way, traders will need to factor in headline risks for the US dollar surrounding both the trade talks and the upcoming summit.

Australian Dollar Performance
- The Australian dollar was modestly higher against the Swiss franc, Japanese yen and New Zealand dollar, and marginally higher (but effectively flat) against the US dollar, Canadian dollar and British pound
- AUD/JPY rose for a sixth consecutive day – its best such run in nearly two months – and now sits at a 2-week high with 100 in its sights
- How it trades this week and which way it gaps at the open is likely down to headlines from US-China trade talks, though the Fed meeting and quarterly CPI figures for Australia are the key economic events
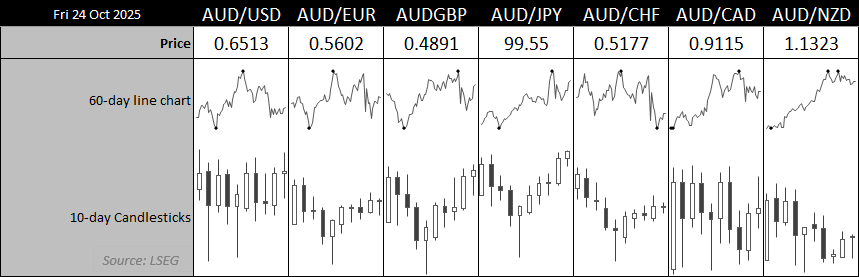
Chart prepared by Matt Simpson - Source: LSEG
Money Markets Favour RBA Cut Next Week
Money markets and economists are increasingly backing a 25bp rate cut by the RBA in November following the latest labour force data. Unemployment rose to a four-year high of 4.5%, while August’s figures for headline and full-time employment were revised further into negative territory. Although participation and employment-to-population rates remain historically high, RBA cash rate futures now imply a 75–80% probability of a cut at the next meeting
Given the hawkish tone of the latest minutes, I place the odds of a cut closer to 60% than 80%. However, the deciding factor will be this week’s quarterly inflation figures.

Chart prepared by Matt Simpson - Source: ABS, LSEG
Australian Quarterly Inflation Report in Focus
As things stand, unemployment has already exceeded the RBA’s end-of-year forecast of 4.3%, with the rate reaching 4.5% by September. The RBA’s Q3 estimates place headline CPI at 2.1% and the trimmed mean at 2.7%. However, monthly gauges of annualised inflation show headline CPI rising to 3.0% and the trimmed mean at 2.6%. It is therefore crucial that the quarterly trimmed mean does not move above 2.7% this week — a print of 2.6% or lower would likely confirm the November rate cut that many already anticipate.
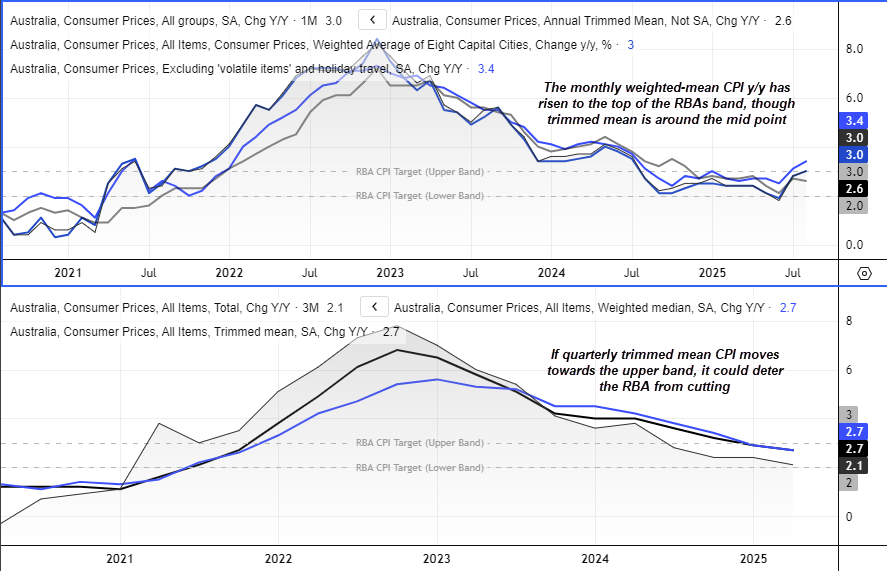
Chart prepared by Matt Simpson - Source: ABS, LSEG
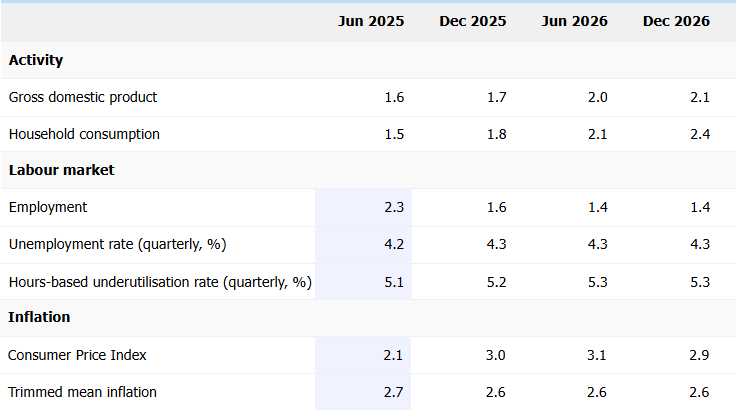
Chart prepared by Matt Simpson - Source: RBA, Statement of Monetary Policy (SOMP)
AUD/USD Correlations
- The usual correlations with the Australian dollar have largely broken down over the 20-day lookback, though the link between AUD/USD and NZD/USD remains strong.
- Even the relationship between the US dollar index and the Australian dollar has weakened to just 0.15 — effectively showing no correlation.
- However, with the 10-day correlation between AUD/USD and copper rising to 0.89 (and the 20-day at 0.68), it suggests the Aussie’s direction could become increasingly influenced by China and developments in trade talks.

 Chart prepared by Matt Simpson - Source: LSEG

AUD/USD Technical Analysis: Australian Dollar vs US Dollar
I don’t often like to adopt a neutral bias, but in this case it’s warranted. The Australian dollar is likely to be caught in the crossfire between risk sentiment driven by US–China trade talks, the Fed meeting, and Australia’s quarterly CPI data.
- The most bearish scenario for AUD/USD would involve deteriorating US–China relations, a less-dovish-than-expected Fed cut, and weak Australian inflation.
- The most bullish outcome would stem from successful trade talks ahead of the Trump–Xi summit, a dovish Fed cut, and an upside surprise in Australia’s CPI report.
- Anything in between could see AUD/USD remain range-bound, with false breakouts and sharp reversals a common theme.
From a technical perspective, traders have clear reference levels to monitor: the 200-day EMA (0.6492), monthly S1 pivot (0.6493), 50-day EMA (0.6538), and the descending trendline resistance.
Purely on a technical basis, I anticipate an initial push higher followed by another leg lower.
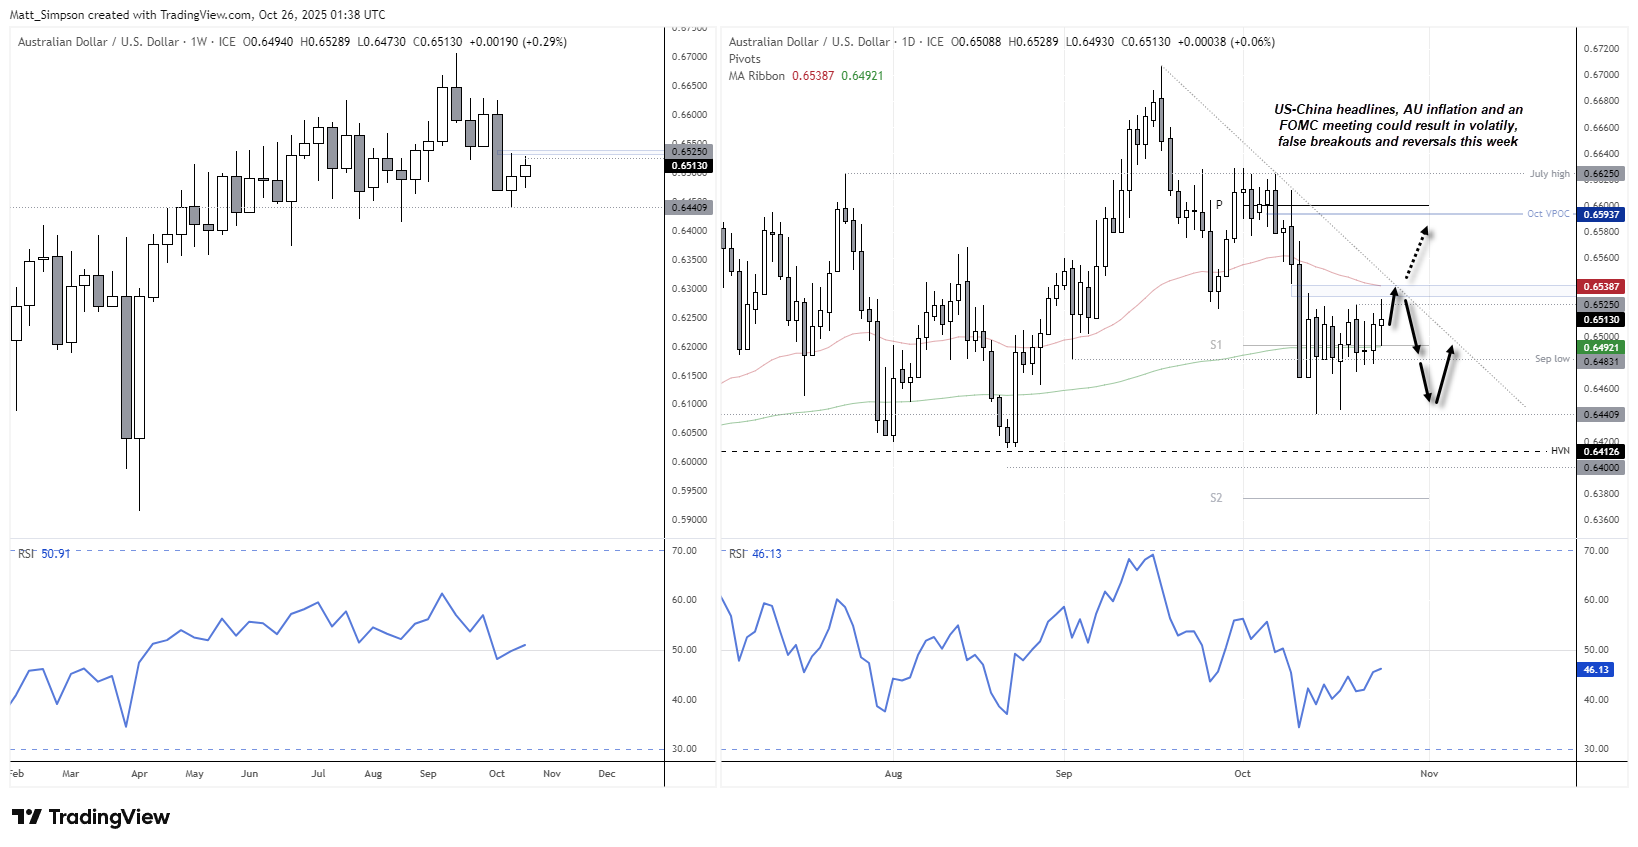
Chart analysis by Matt Simpson - data source: TradingView AUD/USD
View the full economic calendar
-- Written by Matt Simpson
Follow Matt on Twitter @cLeverEdge



Open an account in minutes
Experience award-winning platforms with fast and secure execution, and enjoy tight spreads from 0.5 pts on FX and 0.3 pts on indices.
Economic calendar
Web Trader platform
Our sophisticated web-based platform is packed with features.
Related articles
Australian Dollar Outlook: AUD/USD Screams Sentiment Extreme Into Fed, CPI
AUD/USD rebounds despite record bearish futures positioning, with Australian Q3 CPI and the Fed meeting threatening to trigger another short squeeze.

EUR/USD weekly outlook: FOMC and ECB to set the tone
The current backdrop is modestly bearish. On Friday, the EUR/USD closed modestly lower, down for the third consecutive day. The pair also posted a weekly decline after staging a modest recovery attempt in the previous week. Out of the past 8 weeks, the EUR/USD has fallen on 6 occasions. There is not much supporting factors for the single currency right now. So, the upside remains capped.


USD/JPY Forecast: Is Rising Japanese Inflation Supporting the Yen?
As the trading week comes to an end, one of the most relevant developments in the FX market has been the renewed strength of the Japanese yen. This can be seen in the recent performance of USD/JPY, which has fallen nearly 1.0% over the last two trading sessions, highlighting a meaningful recovery in the Japanese currency against the U.S. dollar.

This report is intended for general circulation only. It should not be construed as a recommendation, or an offer (or solicitation of an offer) to buy or sell any financial products. The information provided does not take into account your specific investment objectives, financial situation or particular needs. Before you act on any recommendation that may be contained in this report, independent advice ought to be sought from a financial adviser regarding the suitability of the investment product, taking into account your specific investment objectives, financial situation or particular needs.
StoneX Financial Pte. Ltd., may distribute reports produced by its respective foreign entities or affiliates within the StoneX group of companies or third parties pursuant to an arrangement under Regulation 32C of the Financial Advisers Regulations. Where the report is distributed to a person in Singapore who is not an accredited investor, expert investor or an institutional investor (as defined in the Securities Futures Act), StoneX Financial Pte. Ltd. accepts legal responsibility to such persons for the contents of the report only to the extent required by law. Singapore recipients should contact StoneX Financial Pte. Ltd. at 6826 9988 for matters arising from, or in connection with the report.
In the case of all other recipients of this report, to the extent permitted by applicable laws and regulations neither StoneX Financial Pte. Ltd. nor its associated companies will be responsible or liable for any loss or damage incurred arising out of, or in connection with, any use of the information contained in this report and all such liability is hereby expressly disclaimed. No representation or warranty is made, express or implied, that the content of this report is complete or accurate.
StoneX Financial Pte. Ltd. is not under any obligation to update this report.
Trading CFDs carries a high level of risk that may not be suitable for some investors. Consider your investment objectives, level of experience, financial resources, risk appetite and other relevant circumstances carefully. The possibility exists that you could lose some or all of your investments, including your initial deposits. If in doubt, please seek independent expert advice. Visit www.forex.com/en-sg/terms-and-policies for the complete Risk Disclosure Statement.