


ASX 200 Morning Market Outlook: Sectors Highlight Structural Weakness
The ASX 200 fell for a third session as cyclical sectors slumped. Internal ratios show weakening risk appetite and signs of structural market fatigue.
Share this:

The ASX 200 extended its decline on Thursday, closing lower for a third consecutive session and erasing all gains from the past two months. While downside momentum appears to be slowing, internal sector ratios — such as Consumer Discretionary versus Staples and Materials versus Technology — are flashing warnings of structural weakness beneath the surface. With inflation pressures lingering and bond yields rising, cyclical sectors continue to underperform defensives, suggesting rallies may remain capped in the near term.
View related analysis:
View related analysis:
ASX 200 Sector Ratios Reveal Structural Fragility
ASX Consumer Discretionary (XDJ) / Consumer Staples (XSJ) Ratio
The Consumer Discretionary (XDJ) to Consumer Staples (XSJ) ratio provides a gauge of risk appetite and effectively represents cyclicals versus defensives within the ASX 200. It’s notable that the XDJ/XSJ ratio is trending lower during this pullback, signalling a risk-off mood across the broader market. Moreover, the ratio has formed a lower high and broken below its previous swing low, marking a potential change in trend.
When viewed alongside the individual sectors, Consumer Discretionary (blue) has fallen sharply with the ASX 200, while Consumer Staples (purple) has been trending higher. This divergence doesn’t bode well for the ASX if the XDJ/XSJ ratio continues to weaken, as it suggests rallies may remain capped in the near term.
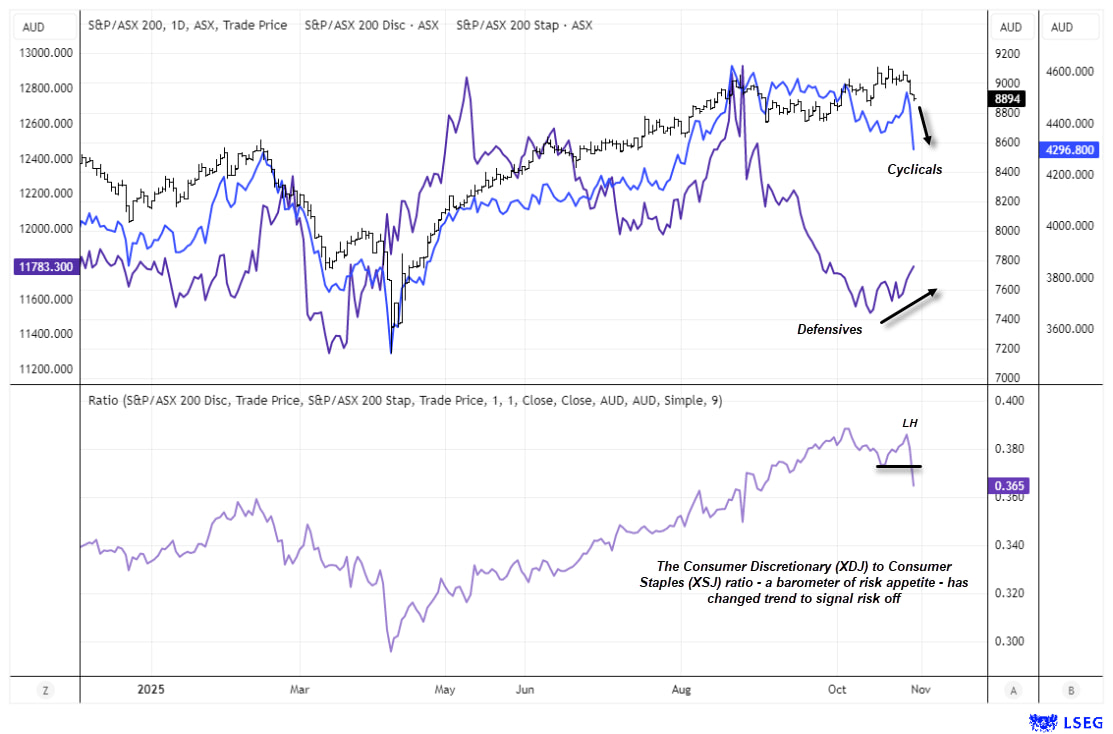
Chart analysis by Matt Simpson - data source: ASX, LSEG


ASX Materials (XMJ) / Information technology (XIJ)
Another useful ratio to monitor is Materials versus Technology. The ASX Materials sector (blue) remains in a solid uptrend, broadly aligned with the strength in commodity markets, while Technology — typically a growth- and risk-sensitive sector — has been topping out since July.
This divergence has driven the XMJ/XIJ ratio sharply higher since the tech sector’s July peak. With Australian CPI surprising to the upside in Q3 and bond yields rising, it’s hard to see this ratio reversing lower any time soon — another factor suggesting the ASX 200 may have topped for now.
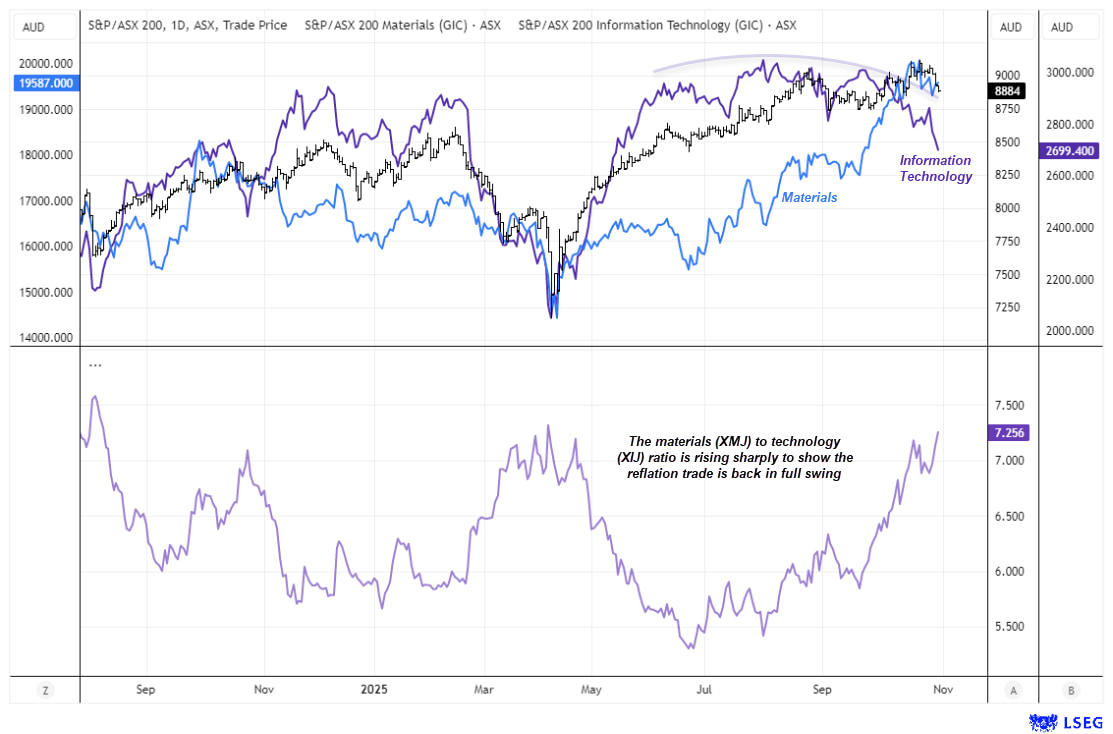
Chart analysis by Matt Simpson - data source: ASX, LSEG
ASX 200 Market Snapshot
- The ASX 200 closed lower for a third straight session, erasing all gains from the past 60 days, though bearish momentum appears to be slowing.
- The monthly candle is on track to form a shooting star, warning that a larger bearish reversal could be developing.
- Consumer Discretionary (XDJ) led seven sectors lower, sliding 4.2% — its worst daily performance in six months.
- Wesfarmers (WES) plunged 7% to a 12-week low, marking its worst day in two and a half years, and was the biggest decliner across both the ASX 200 and the Consumer Discretionary sector.
- Real Estate (XRE) fell 2.3%, with sentiment still weighed by the RBA’s high-for-longer policy stance following Wednesday’s strong CPI report.
- Information Technology (XIJ) dropped 1.5%, underscoring the broad risk-off tone across the market.
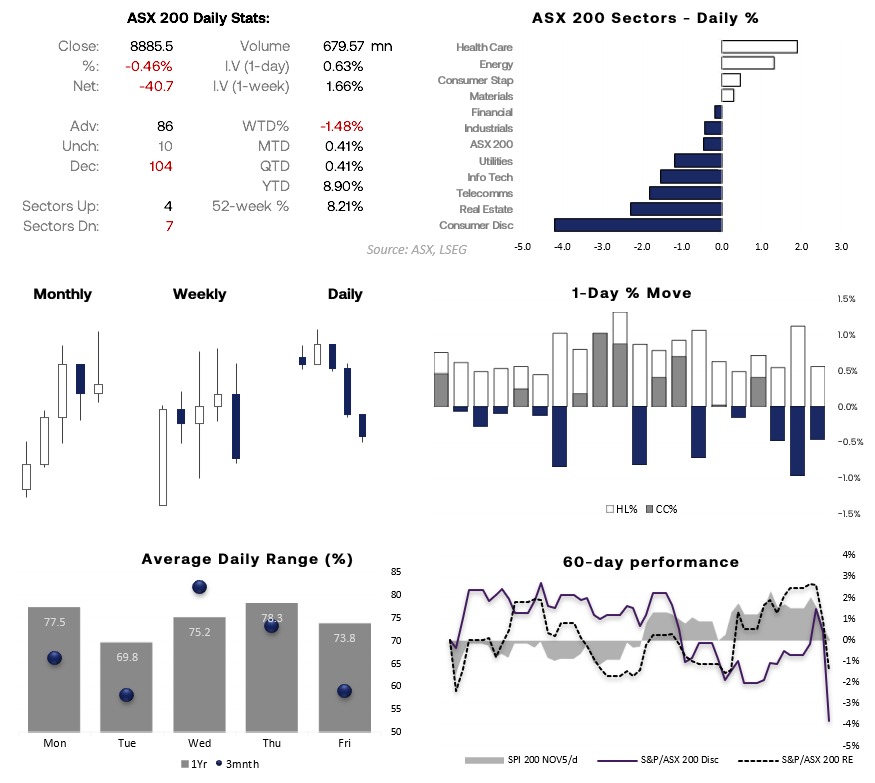
Chart analysis by Matt Simpson - source: ASX, LSEG


Woolworths (WOW) surges to a 2-month high
Last Thursday I outlined a bullish bias for Woolworths (WOW), and it has not disappointed. While prices initially spiked lower on Wednesday, losses were brief before a strong bullish reversal unfolded, with shares closing at the session high for a 2.4% gain.
A gap higher on Thursday was followed by continued upside, suggesting we may have seen a breakaway gap — a pattern that typically forms when prices break out from major lows and mark the start of a new short-term trend.
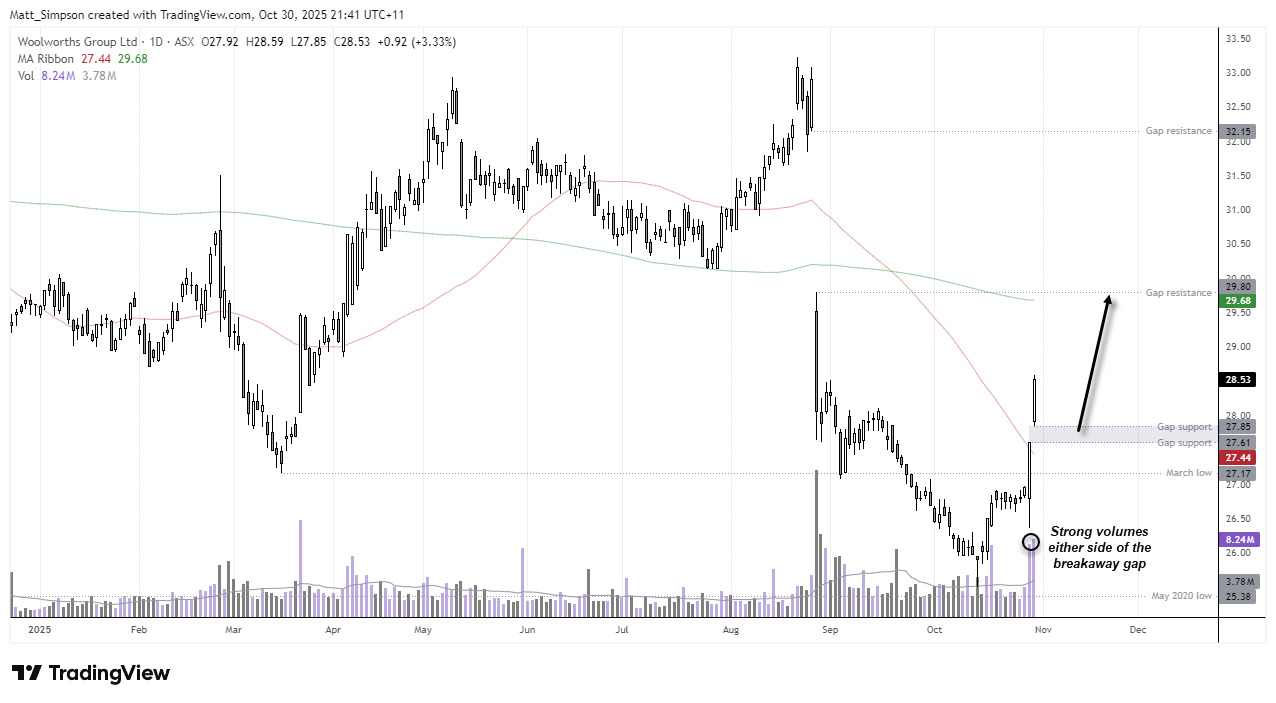
Chart analysis by Matt Simpson - data source: TradingView
ASX 200 Technical Analysis
Price action on the ASX 200 weekly chart is looking increasingly bearish. Momentum has turned lower following the formation of a wide-legged spinning top doji and a small shooting star near record highs, while a multi-month bearish divergence has developed on both the RSI (14) and RSI (2) indicators.
Combined with the risk-off signals seen in the ASX 200’s internal ratios, this suggests the market may be entering the early stages of a correction, with bears likely to fade into rallies. A move back towards the February high (8,615), 50-week SMA (8,455), or even the 8,200 handle appears possible in the coming weeks.
If that sounds excessive, it’s worth noting that none of these targets even reach the 38.2% Fibonacci retracement of the rally from the April low to the October high — a perfectly normal pullback in trending markets. For context, a decline from the October high to the 50-week SMA would represent a 7.2% correction, compared with the 17.8% pullback that followed the February peak.
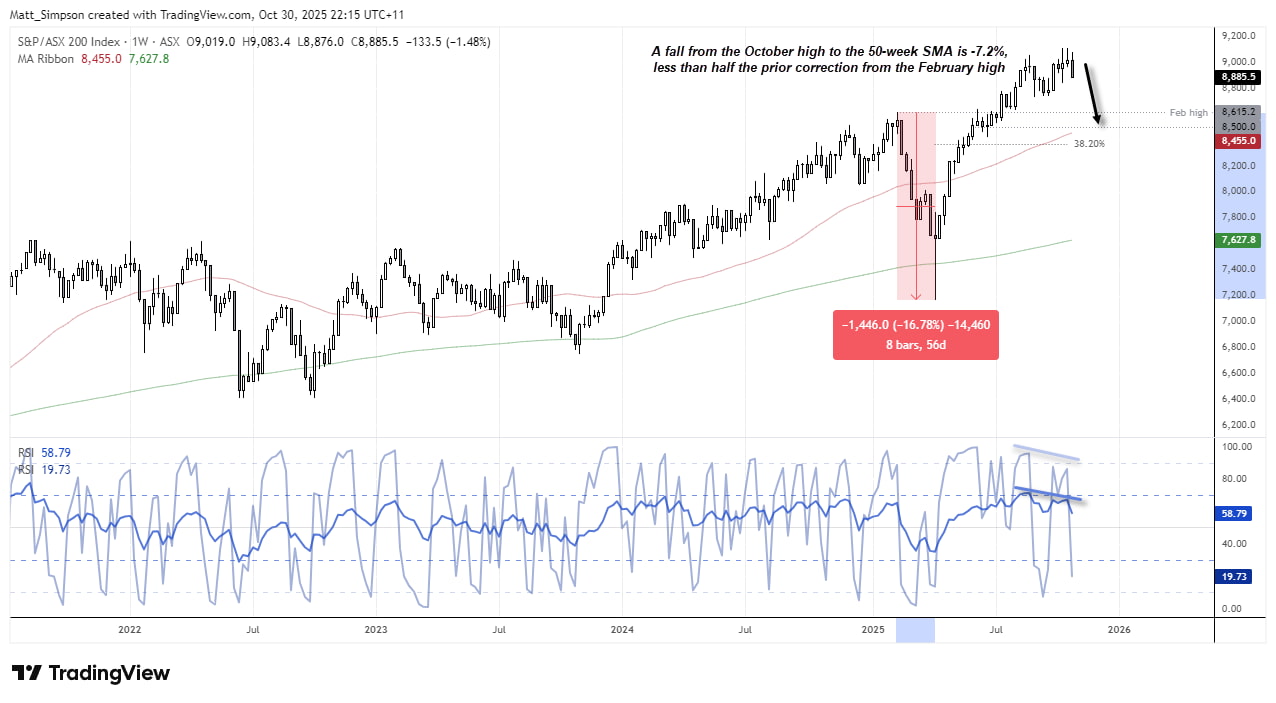
Chart analysis by Matt Simpson - Source: TradingView, S&P/ASX 200 Index
View the full economic calendar
View the full economic calendar
-- Written by Matt Simpson
Follow Matt on Twitter @cLeverEdge
How to trade with City Index
You can trade with City Index by following these four easy steps:
- Open an account, or log in if you’re already a customer
• Open an account in the UK
• Open an account in Australia
• Open an account in Singapore
- Search for the market you want to trade in our award-winning platform
- Choose your position and size, and your stop and limit levels
- Place the trade
Related tags:




Open an account in minutes
Experience award-winning platforms with fast and secure execution, and enjoy tight spreads from 0.5 pts on FX and 0.3 pts on indices.
Economic calendar
Web Trader platform
Our sophisticated web-based platform is packed with features.
Related articles
Australian Dollar Outlook: AUD/USD Screams Sentiment Extreme Into Fed, CPI
AUD/USD rebounds despite record bearish futures positioning, with Australian Q3 CPI and the Fed meeting threatening to trigger another short squeeze.

S&P 500 forecast: AI linked stocks remain under pressure
And just like that, it is Friday again and the end of a volatile week. Today offers little on the macro calendar to change the prevailing narrative, leaving markets largely at the mercy of risk appetite, oil prices and the growing unease around the AI trade.


USD/JPY, Nikkei Break Lower as AI Meltdown Spreads
Thursday’s tech tantrum has become Friday’s fire sale. With Nikkei support giving way and the yen strengthening, could the selling start feeding on itself?

This report is intended for general circulation only. It should not be construed as a recommendation, or an offer (or solicitation of an offer) to buy or sell any financial products. The information provided does not take into account your specific investment objectives, financial situation or particular needs. Before you act on any recommendation that may be contained in this report, independent advice ought to be sought from a financial adviser regarding the suitability of the investment product, taking into account your specific investment objectives, financial situation or particular needs.
StoneX Financial Pte. Ltd., may distribute reports produced by its respective foreign entities or affiliates within the StoneX group of companies or third parties pursuant to an arrangement under Regulation 32C of the Financial Advisers Regulations. Where the report is distributed to a person in Singapore who is not an accredited investor, expert investor or an institutional investor (as defined in the Securities Futures Act), StoneX Financial Pte. Ltd. accepts legal responsibility to such persons for the contents of the report only to the extent required by law. Singapore recipients should contact StoneX Financial Pte. Ltd. at 6826 9988 for matters arising from, or in connection with the report.
In the case of all other recipients of this report, to the extent permitted by applicable laws and regulations neither StoneX Financial Pte. Ltd. nor its associated companies will be responsible or liable for any loss or damage incurred arising out of, or in connection with, any use of the information contained in this report and all such liability is hereby expressly disclaimed. No representation or warranty is made, express or implied, that the content of this report is complete or accurate.
StoneX Financial Pte. Ltd. is not under any obligation to update this report.
Trading CFDs carries a high level of risk that may not be suitable for some investors. Consider your investment objectives, level of experience, financial resources, risk appetite and other relevant circumstances carefully. The possibility exists that you could lose some or all of your investments, including your initial deposits. If in doubt, please seek independent expert advice. Visit www.forex.com/en-sg/terms-and-policies for the complete Risk Disclosure Statement.