



ASX 200 Slides Further as Tech, Discretionary and Real Estate Crack
ASX 200 weakness deepens as Tech, Discretionary and Real Estate lead the selloff, with rising RBA hike risks adding further pressure.
Share this:

The wheels are coming off the ASX 200 as its bearish move gathers pace. Regular readers will know I’ve held a negative view on the Australian share market in recent weeks, driven by price action clues among key ASX sectors.
View related analysis:
View related analysis:
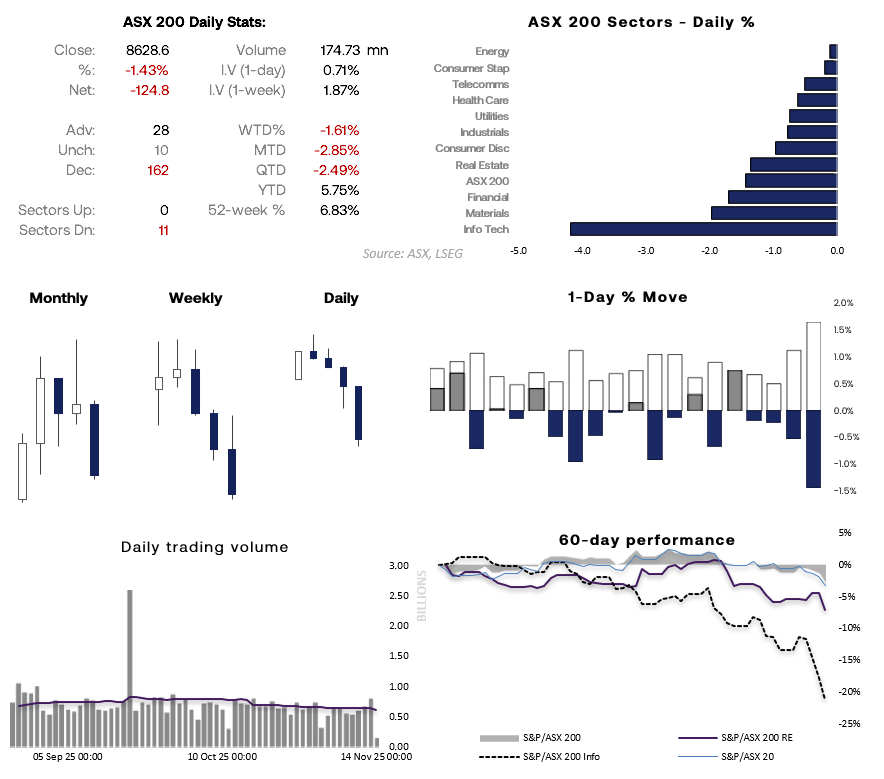
Chart analysis by Matt Simpson - data source: ASX, LSEG
Information Technology (XIJ) has been trending lower since its September peak after forming a double top above 3,000. Frothy tech valuations have become a growing concern on Wall Street, with heavy Nasdaq selling dragging the ASX tech sector with it. Consumer Discretionary (XDJ) has also been sliding for several weeks, with downside momentum accelerating through late October after topping out in August. This is a classic risk-off rotation as investors move away from cyclicals and into defensives such as Utilities. But even Utilities (XUJ) have turned lower following Wall Street’s selloff and rising risks that the RBA may hike rates next year.
In recent weeks, markets have had to absorb a hawkish RBA hold, rising inflation, a record jump in home loans, and now lower unemployment alongside firm job creation. These are hallmarks of an economy that’s heating up — and the prospect of an RBA hike wasn’t even on the ASX’s radar until this week.
If Australian economic data continues to heat up and raise expectations of hawkish talk from the RBA, it could weigh further on sectors such as Real Estate (XRE).


ASX 200 Real Estate (XEJ) Under Pressure as Goodman Group (GMG) Leads Megacaps Lower
The ASX 200 Real Estate sector (XEJ) peaked in August at a record high and has fallen roughly 10% over the past 14 days since its October high. A bear flag formed last week, and bearish momentum has clearly re-asserted itself. The XEJ/ASX ratio also shows the sector underperforming the broader market, despite the wider index facing selling pressure of its own. Thursday delivered the sector’s worst session in seven months, sliding -2.7%.
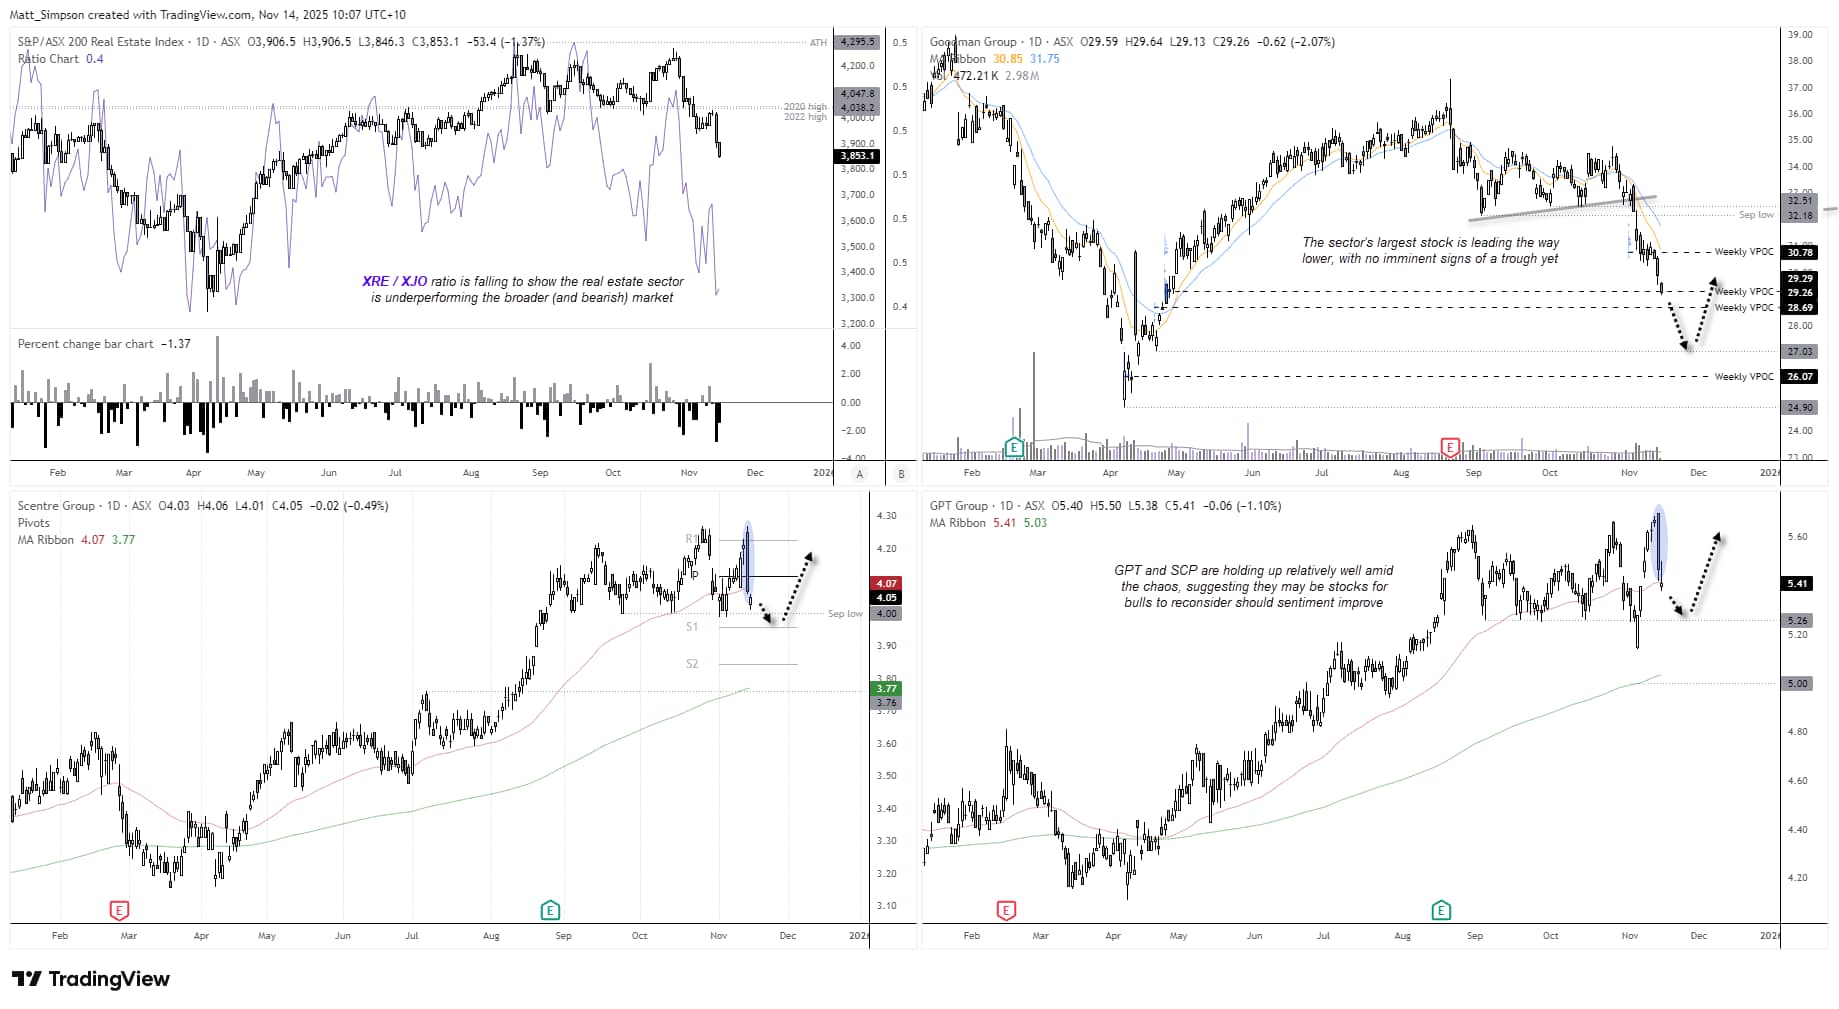
Chart analysis by Matt Simpson - data source: TradingView, ASX
Goodman Group (GMG)
The sector heavyweight is under strain, with Goodman Group (GMG) dropping to a seven-month low. GMG has now entered a technical bear market after falling more than 20% from its August high. Prices are trying to hold above a weekly VPOC at 29.29, but with no signs of a base forming, further downside towards the 28.69 VPOC remains possible. A break under 27 would expose the next VPOC at 26.07.
Scentre Group (SCG)
SCG is holding up relatively well despite the broader sector selloff. While an extended bearish engulfing candle formed on Thursday, prices are attempting to hold above the September low. With the $4 handle and monthly S1 pivot at 3.95 nearby, this may be one for bulls to consider if sentiment turns. For now, my bias remains neutral.
GPT Group (GPT)
GPT is showing a similar pattern to SCG: the stock is under pressure due to the risk-off tone, but it is holding up better than both the ASX 200 and the XRE sector. GPT is outperforming SCG, trading around its 50-day EMA and well above its September low. If sentiment improves, this is another stock bulls may look to.


REA Group (REA) Caught Between Technology and Real Estate Selloff
While REA sits within the ASX Communication Services Index (XTJ), its revenue is heavily tied to property activity. If rising interest rates slow housing turnover, earnings expectations for REA typically fall — which explains why the stock often trades more like a real-estate proxy than a pure media company.
This is reflected in its current behaviour: REA’s 20-day correlation with the XRE real estate sector sits at a strong 0.92 and is still rising. The price action also suggests REA is leading the XRE sector (purple) lower, and its relationship with XRE is notably stronger than with its official sector, XTJ (green).
The weekly chart shows a lower high forming in August, beneath the record peak set in February. The current decline may be part of a simple ABC pullback within the longer-term uptrend, or the early stages of a 5-wave bearish sequence.
The 100% projection of wave A from wave B falls around 190 — a level REA needs to hold to maintain the ABC correction scenario. A decisive break below 190 would open the door to a deeper selloff. The 50% retracement aligns with the 180 handle, while the 138.2% extension and 61.8% retracement cluster around 160, creating a notable downside zone for bears if 190 gives way.
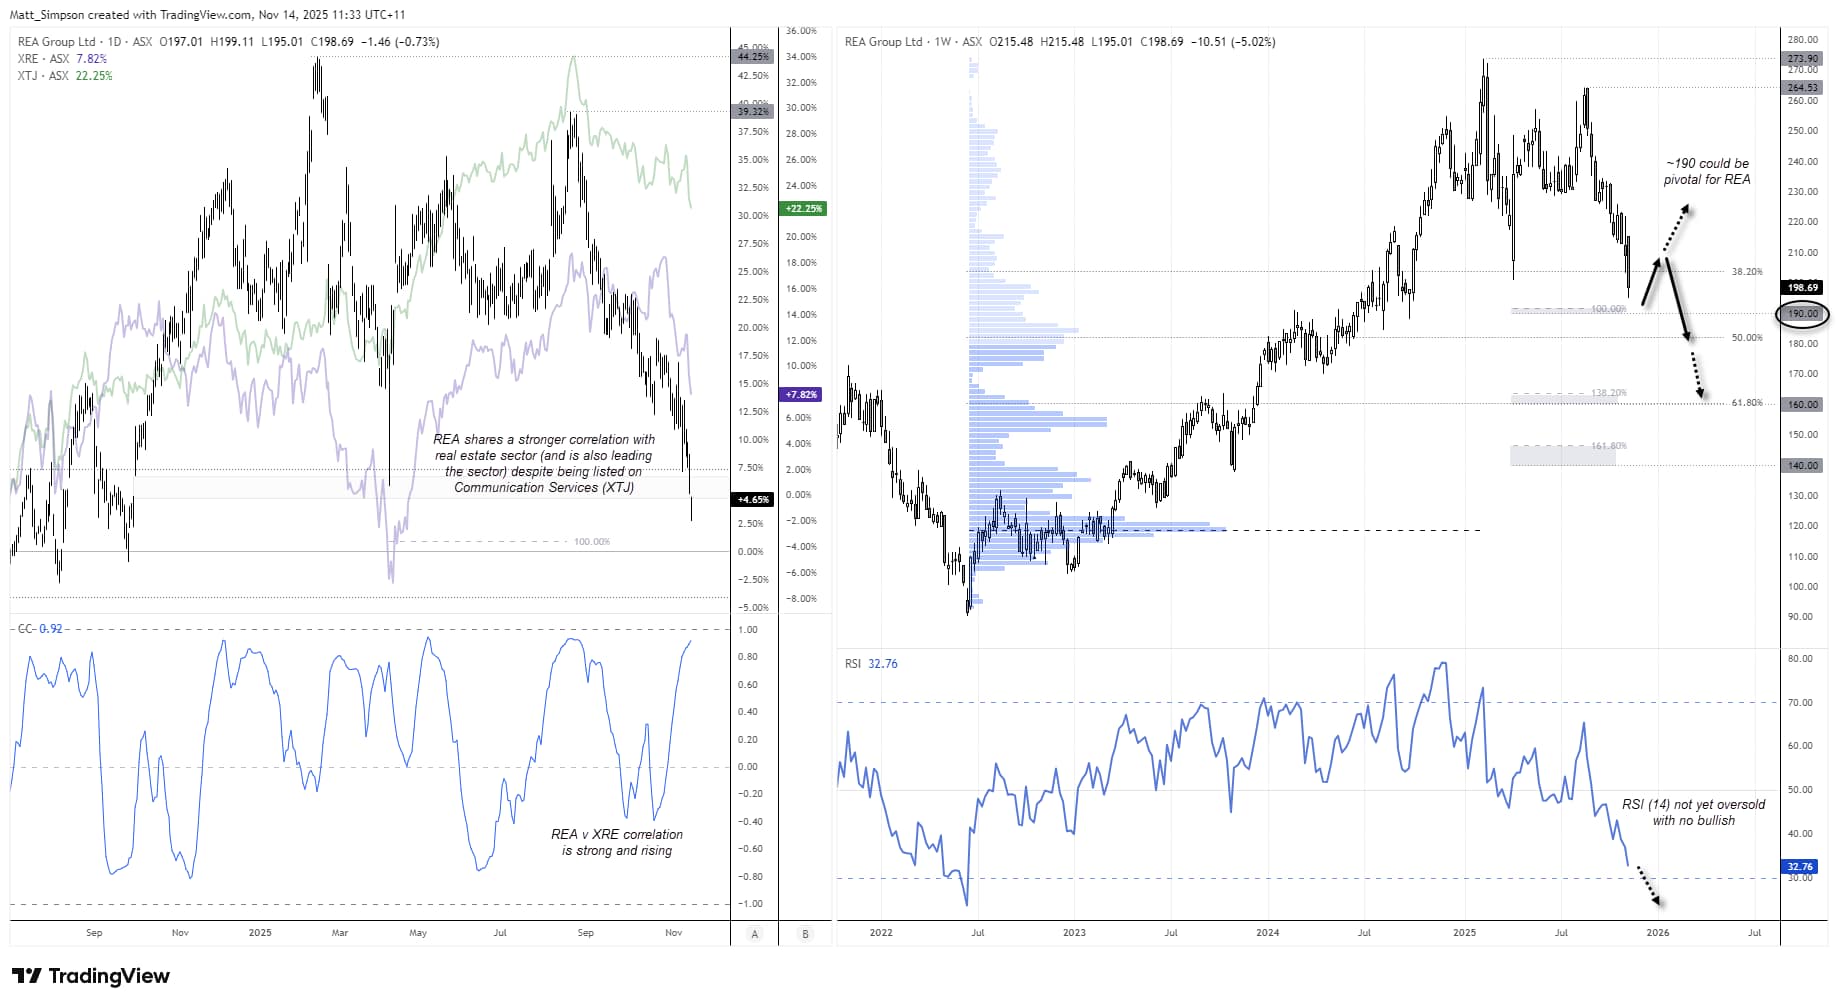
Chart analysis by Matt Simpson - data source: TradingView, ASX
View the full economic calendar
View the full economic calendar
-- Written by Matt Simpson
Follow Matt on Twitter @cLeverEdge
How to trade with City Index
You can trade with City Index by following these four easy steps:
- Open an account, or log in if you’re already a customer
• Open an account in the UK
• Open an account in Australia
• Open an account in Singapore
- Search for the market you want to trade in our award-winning platform
- Choose your position and size, and your stop and limit levels
- Place the trade
Latest market news




Open an account in minutes
Experience award-winning platforms with fast and secure execution, and enjoy tight spreads from 0.5 pts on FX and 0.3 pts on indices.
Economic calendar
Web Trader platform
Our sophisticated web-based platform is packed with features.
Related articles
EUR/USD weekly outlook: FOMC and ECB to set the tone
The current backdrop is modestly bearish. On Friday, the EUR/USD closed modestly lower, down for the third consecutive day. The pair also posted a weekly decline after staging a modest recovery attempt in the previous week. Out of the past 8 weeks, the EUR/USD has fallen on 6 occasions. There is not much supporting factors for the single currency right now. So, the upside remains capped.

Silver forecast: metals liquidation drags XAG/USD into $50-55 support
Silver has broken its July low and slipped into a long-term support zone as the selling in precious metals deepens. The chart shows where the metal could bottom, and next week's Fed decision may decide whether it does.

S&P 500 forecast: AI linked stocks remain under pressure
And just like that, it is Friday again and the end of a volatile week. Today offers little on the macro calendar to change the prevailing narrative, leaving markets largely at the mercy of risk appetite, oil prices and the growing unease around the AI trade.
This report is intended for general circulation only. It should not be construed as a recommendation, or an offer (or solicitation of an offer) to buy or sell any financial products. The information provided does not take into account your specific investment objectives, financial situation or particular needs. Before you act on any recommendation that may be contained in this report, independent advice ought to be sought from a financial adviser regarding the suitability of the investment product, taking into account your specific investment objectives, financial situation or particular needs.
StoneX Financial Pte. Ltd., may distribute reports produced by its respective foreign entities or affiliates within the StoneX group of companies or third parties pursuant to an arrangement under Regulation 32C of the Financial Advisers Regulations. Where the report is distributed to a person in Singapore who is not an accredited investor, expert investor or an institutional investor (as defined in the Securities Futures Act), StoneX Financial Pte. Ltd. accepts legal responsibility to such persons for the contents of the report only to the extent required by law. Singapore recipients should contact StoneX Financial Pte. Ltd. at 6826 9988 for matters arising from, or in connection with the report.
In the case of all other recipients of this report, to the extent permitted by applicable laws and regulations neither StoneX Financial Pte. Ltd. nor its associated companies will be responsible or liable for any loss or damage incurred arising out of, or in connection with, any use of the information contained in this report and all such liability is hereby expressly disclaimed. No representation or warranty is made, express or implied, that the content of this report is complete or accurate.
StoneX Financial Pte. Ltd. is not under any obligation to update this report.
Trading CFDs carries a high level of risk that may not be suitable for some investors. Consider your investment objectives, level of experience, financial resources, risk appetite and other relevant circumstances carefully. The possibility exists that you could lose some or all of your investments, including your initial deposits. If in doubt, please seek independent expert advice. Visit www.forex.com/en-sg/terms-and-policies for the complete Risk Disclosure Statement.