


Australian Dollar Outlook: AUD/USD, AUD/JPY, GBP/AUD Ahead of CPI, FOMC
AUD/USD eyes breakout as CPI and FOMC loom. AUD/JPY trends higher while GBP/AUD remains under pressure near key support levels.
Share this:

The Australian dollar faces a key volatility event with Australia’s CPI and the Federal Reserve decision due within 24 hours. AUD/USD is testing resistance near 0.72, while AUD/JPY and GBP/AUD sit at pivotal technical levels. Whether the Aussie breaks higher or slips back into range may come down to inflation data and the Fed’s tone.
View related analysis:
View related analysis:
Australian Dollar Forecast: AUD/USD, AUD/JPY and GBP/AUD Set for CPI and FOMC
Australian CPI in Focus for AUD/USD Traders
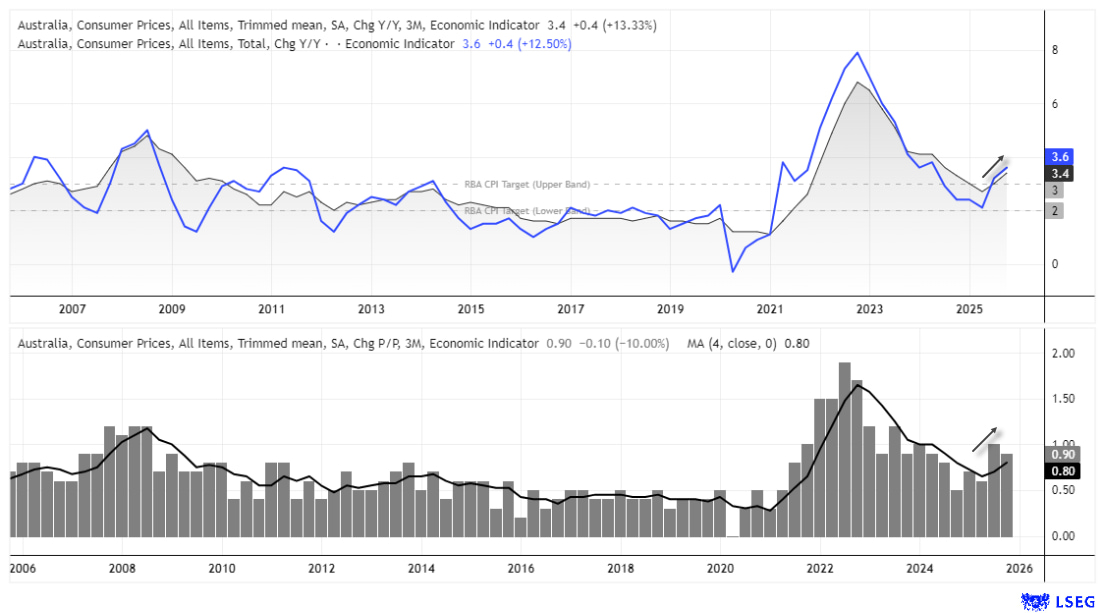
There is a decent chance trimmed mean CPI ticks higher to 3.5% or above, marking a second consecutive quarter above the RBA’s 2–3% target band and reinforcing bets for three 25bp hikes this year. Cash rate futures currently imply 61bp of tightening—more than two 25bp hikes—and a 74% chance of the next move arriving in May. A slightly hotter print would effectively confirm a May hike, which already appears highly likely—and could give AUD/USD another lift within an already bullish trend.
LSEG, ABS (Australian Bureau of Statistics)
Trimmed Mean CPI Could Reinforce RBA Hike Expectations
There is a decent chance trimmed mean CPI will tick higher to 3.5% or above to mark the second consecutive quarter above the RBA’s 2-3% target band and bolster bets for three 25bp hikes this year. Cash rate futures currently imply 61bp of hikes – more than two 25bo hikes – and a 74% chance of the next one arriving in May. A slightly hotter print effectively confirms a May hike, though it seems quite likely already. And should given AUD/USD another bump in an already bullish trend.


Fed Decision Key to Whether AUD/USD Breaks Higher
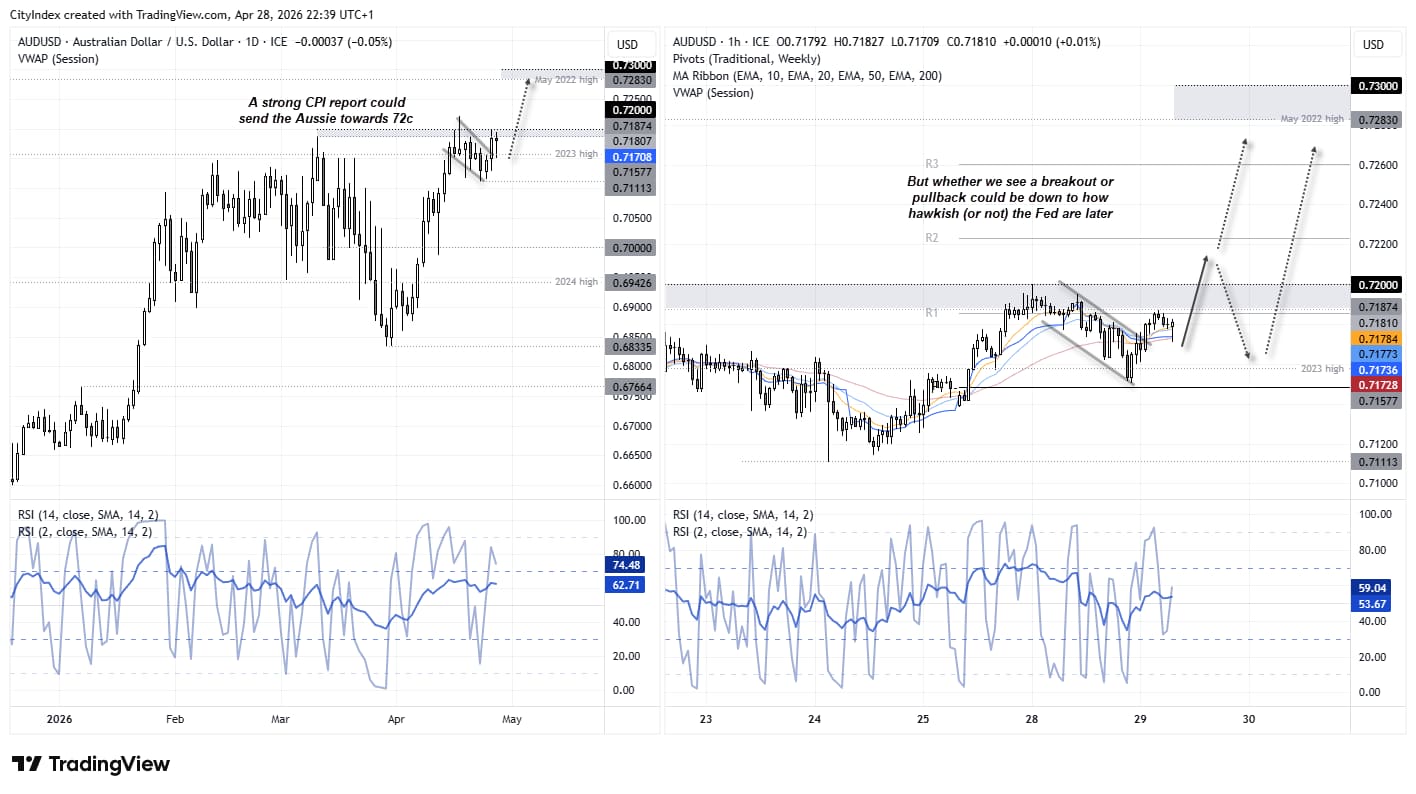
The bigger question to me is whether we’ll see a breakout this week. My core bias is to eventually see AUD/USD head for 75c, but there is a risk we’ll also see the Aussie retreat back within last week’s range if the Fed deliver a hawkish hold. Which seems likely given the backdrop of the Middle East and rising inflationary pressures.
AUD/USD Technical Analysis: Australian Dollar vs US Dollar
The potential bull flag breakout on the AUD/USD daily chart, highlighted over the weekend, got to work immediately at Monday’s open. The rally from the March low has been strong into cycle highs, with momentum building within an already established uptrend from the April 2025 low—favouring a potential break above 0.72.
However, the Aussie risks handing back some of its CPI-driven gains if the Fed delivers the hawkish tone I anticipate. This could see AUD/USD test 0.72 in the near term before pulling back into its recent range—even if only temporarily.
That said, a less-hawkish Fed hold would likely pave the way for a sustained break above 0.72. In that scenario, the May 2022 high (0.7286) and the 0.7300 handle come into focus for AUD/USD bulls.
Source: ICE, TradingView


GBP/AUD Technical Analysis: British Pound vs Australian Dollar
The British pound has been within a clear downtrend against the Australian dollar for one year, sending GBP/AUD to a 15-month low in March. A two-week countertrend bounce failed to hold above the 200-week SMA and struggled to even retest the 200-week EMA before momentum reverted lower for the next three weeks. Prices are now teasing the lows of the 3-week decline ahead of today’s CPI print, as GBP/AUD prepares for its next leg lower.
A bearish engulfing candle formed on Monday to suggest a lower high formed just below 1.90. Bears could seek to fade into moves towards the May 2024 low (1.8825) within the March low (1.8696) initially in view – a break beneath which brings the May 2024 low into focus (1.8588).

Source: ICE, TradingView
AUD/JPY Technical Analysis: Australian Dollar vs Japanese Yen
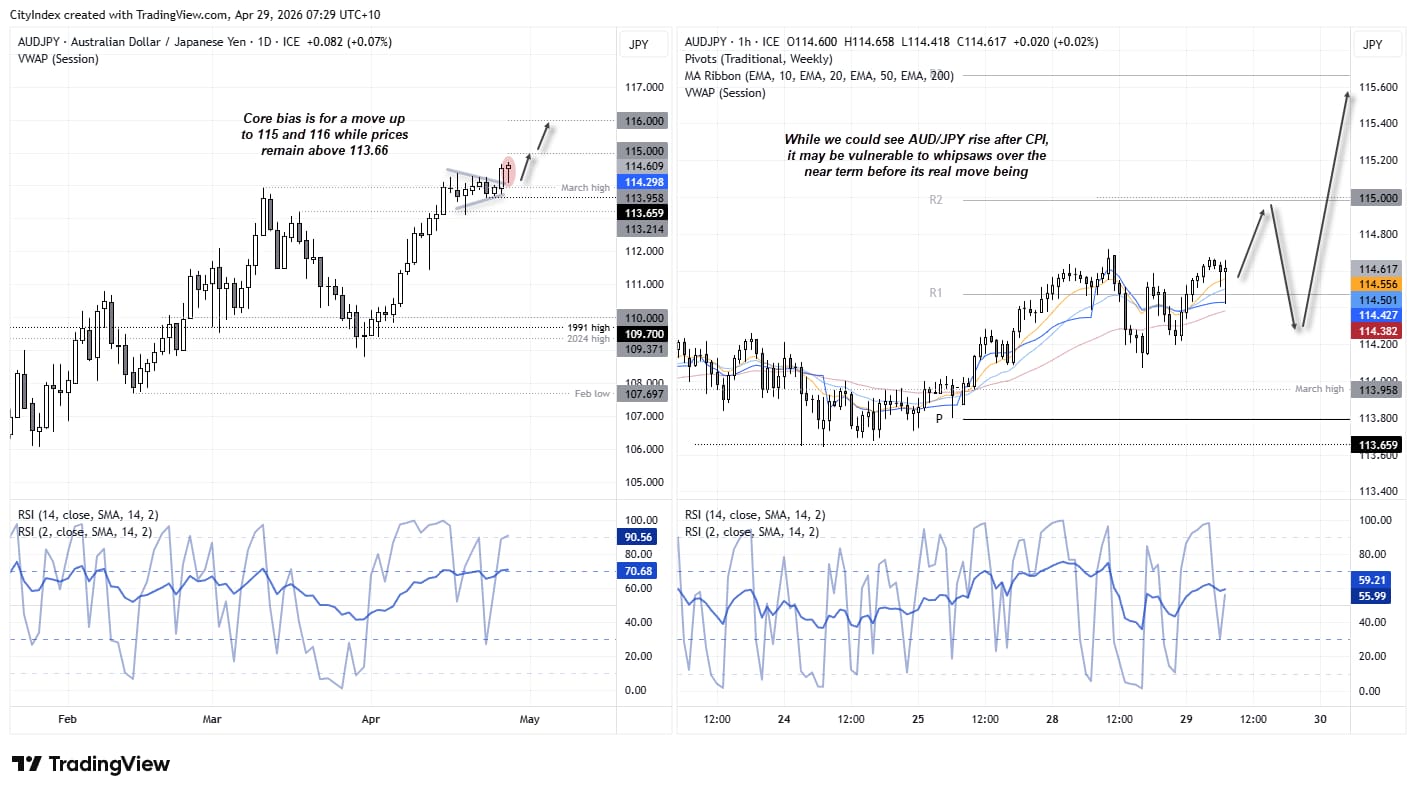
The Australian dollar has been a clear outperformer against the Japanese yen since last April, with AUD/JPY trending higher in a relatively clean fashion. Momentum has turned higher once more from a tight consolidation around 114, and even the BOJ’s hawkish meeting failed to derail the move. Instead, AUD/JPY is now retesting its highs ahead of today’s inflation report.
However, the hammer candle on the daily chart warns that bullish momentum may be fading in the near term. So while AUD/JPY could initially push higher after CPI, there is a risk of a pullback back into its recent range—especially as the yen shows signs of strength elsewhere.
Despite the risk of near-term volatility, my core bias remains for AUD/JPY to head towards 115 and 116 while prices hold above 113.66. A break beneath this level would instead confirm a deeper retracement is underway, within what remains a broader bullish trend.
Source: ICE, TradingView
View the full economic calendar
View the full economic calendar
-- Written by Matt Simpson
Follow Matt on Twitter @cLeverEdge
How to trade with City Index
You can trade with City Index by following these four easy steps:
- Open an account, or log in if you’re already a customer
• Open an account in the UK
• Open an account in Australia
• Open an account in Singapore
- Search for the market you want to trade in our award-winning platform
- Choose your position and size, and your stop and limit levels
- Place the trade
Related tags:



Open an account in minutes
Experience award-winning platforms with fast and secure execution, and enjoy tight spreads from 0.5 pts on FX and 0.3 pts on indices.
Economic calendar
Web Trader platform
Our sophisticated web-based platform is packed with features.
Related articles
Australian Dollar Outlook: AUD/USD Screams Sentiment Extreme Into Fed, CPI
AUD/USD rebounds despite record bearish futures positioning, with Australian Q3 CPI and the Fed meeting threatening to trigger another short squeeze.

EUR/USD weekly outlook: FOMC and ECB to set the tone
The current backdrop is modestly bearish. On Friday, the EUR/USD closed modestly lower, down for the third consecutive day. The pair also posted a weekly decline after staging a modest recovery attempt in the previous week. Out of the past 8 weeks, the EUR/USD has fallen on 6 occasions. There is not much supporting factors for the single currency right now. So, the upside remains capped.


USD/JPY Forecast: Is Rising Japanese Inflation Supporting the Yen?
As the trading week comes to an end, one of the most relevant developments in the FX market has been the renewed strength of the Japanese yen. This can be seen in the recent performance of USD/JPY, which has fallen nearly 1.0% over the last two trading sessions, highlighting a meaningful recovery in the Japanese currency against the U.S. dollar.

This report is intended for general circulation only. It should not be construed as a recommendation, or an offer (or solicitation of an offer) to buy or sell any financial products. The information provided does not take into account your specific investment objectives, financial situation or particular needs. Before you act on any recommendation that may be contained in this report, independent advice ought to be sought from a financial adviser regarding the suitability of the investment product, taking into account your specific investment objectives, financial situation or particular needs.
StoneX Financial Pte. Ltd., may distribute reports produced by its respective foreign entities or affiliates within the StoneX group of companies or third parties pursuant to an arrangement under Regulation 32C of the Financial Advisers Regulations. Where the report is distributed to a person in Singapore who is not an accredited investor, expert investor or an institutional investor (as defined in the Securities Futures Act), StoneX Financial Pte. Ltd. accepts legal responsibility to such persons for the contents of the report only to the extent required by law. Singapore recipients should contact StoneX Financial Pte. Ltd. at 6826 9988 for matters arising from, or in connection with the report.
In the case of all other recipients of this report, to the extent permitted by applicable laws and regulations neither StoneX Financial Pte. Ltd. nor its associated companies will be responsible or liable for any loss or damage incurred arising out of, or in connection with, any use of the information contained in this report and all such liability is hereby expressly disclaimed. No representation or warranty is made, express or implied, that the content of this report is complete or accurate.
StoneX Financial Pte. Ltd. is not under any obligation to update this report.
Trading CFDs carries a high level of risk that may not be suitable for some investors. Consider your investment objectives, level of experience, financial resources, risk appetite and other relevant circumstances carefully. The possibility exists that you could lose some or all of your investments, including your initial deposits. If in doubt, please seek independent expert advice. Visit www.forex.com/en-sg/terms-and-policies for the complete Risk Disclosure Statement.