



Australian Dollar Outlook: Strait of Hormuz Risk Clouds AUD/USD Rally
AUD/USD holds firm, but Strait of Hormuz risks, RBA policy and positioning extremes threaten to derail the Australian dollar rally.
Share this:

The Australian dollar is holding up better than many expected, supported by hawkish RBA expectations and resilient domestic data. But beneath the surface, cracks are forming.
Positioning is becoming increasingly stretched, options markets are skewing bearish, and geopolitical risks in the Middle East are threatening to inject fresh volatility into global markets. With the Strait of Hormuz back in focus and oil prices elevated, traders face a more complex backdrop where risk sentiment and inflation dynamics could quickly shift the narrative for AUD/USD.
View related analysis:
View related analysis:
Strait of Hormuz Risk Clouds the Australian Dollar
Australian Dollar Performance
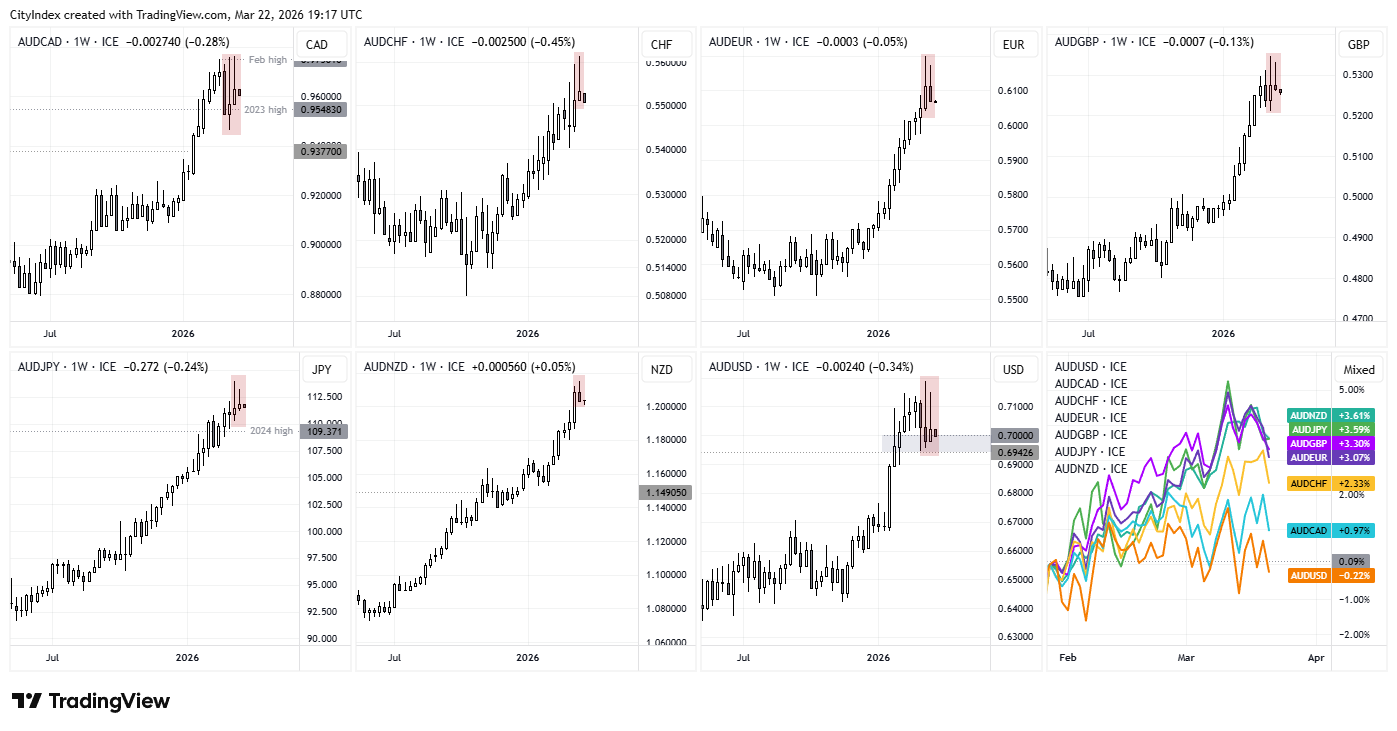
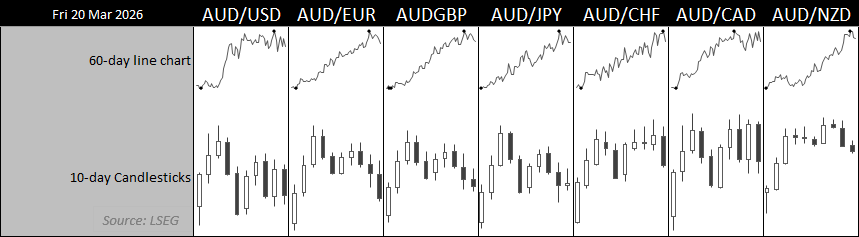
The Australian dollar continues to show signs of a fatigued rally when comparing price action among its peers on the weekly chart, yet it remains a market that has, for now at least, failed to commit to a meaningful pullback.
- While AUD/USD closed 0.6% higher for the week, it was the weakest FX major on Friday, falling -1% and forming another volatile shooting star candle to warn of weakness in the trend
- AUD/CAD also formed a volatile 1-week reversal candle, once again stalling around the February high
- AUD/NZD snapped a 7-week winning streak and failed to close above 1.12 for a second consecutive week
- AUD/JPY formed a small bullish inside bar, alongside its second consecutive shooting star candle to warn of weakness around 112
- EUR/AUD snapped a record-breaking 12-week bearish run with a small bullish inside week
- GBP/AUD formed a small bullish pinbar, also hinting at a near-term inflection point against an otherwise strong bearish trend
Source: LSEG, TradingView
Australia This Week: Economic Data and Events for AUD/USD Traders
The RBA delivered its expected 25bp hike, and the only factor preventing a more hawkish stance was, of course, the war in Iran. The decision was surprisingly close, with a 5–4 split in favour of the hike. For now, RBA cash rate futures imply a 67% chance of another hike to 4.35% in May.
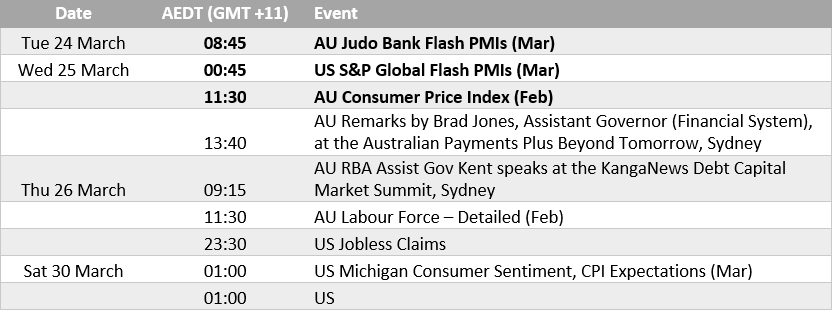
This places greater emphasis on Wednesday’s monthly inflation report. It will not capture the recent crude oil spike stemming from the Middle East, but it may not need to—as even a modest uptick from already elevated inflation would remind the RBA that price pressures persist.
The bigger unknown is how long the conflict in the Middle East will last and what impact it will have on the local economy. However, with PMIs trending higher, the case for a hold in May already appears to be fading.
Strait of Hormuz Risk Puts Markets on Edge
Of course, the bigger elephant in the room is the Middle East. President Trump has reportedly issued a 48-hour ultimatum for Iran to reopen the Strait of Hormuz or face potential strikes on key infrastructure.
This sets up a potentially volatile start to the week—likely spilling into Tuesday morning in Australia if the deadline passes without resolution, given the timing of US market hours.
Iran appears to have few favourable options. Conceding quickly risks signalling weakness, particularly for a new leadership facing internal and external pressure. That raises the risk of a prolonged standoff, which in turn keeps upside risks for oil prices and safe-haven flows firmly in play.


AUD/USD Technical Analysis: Australian Dollar vs US Dollar
AUD/USD Futures Positioning | COT Report
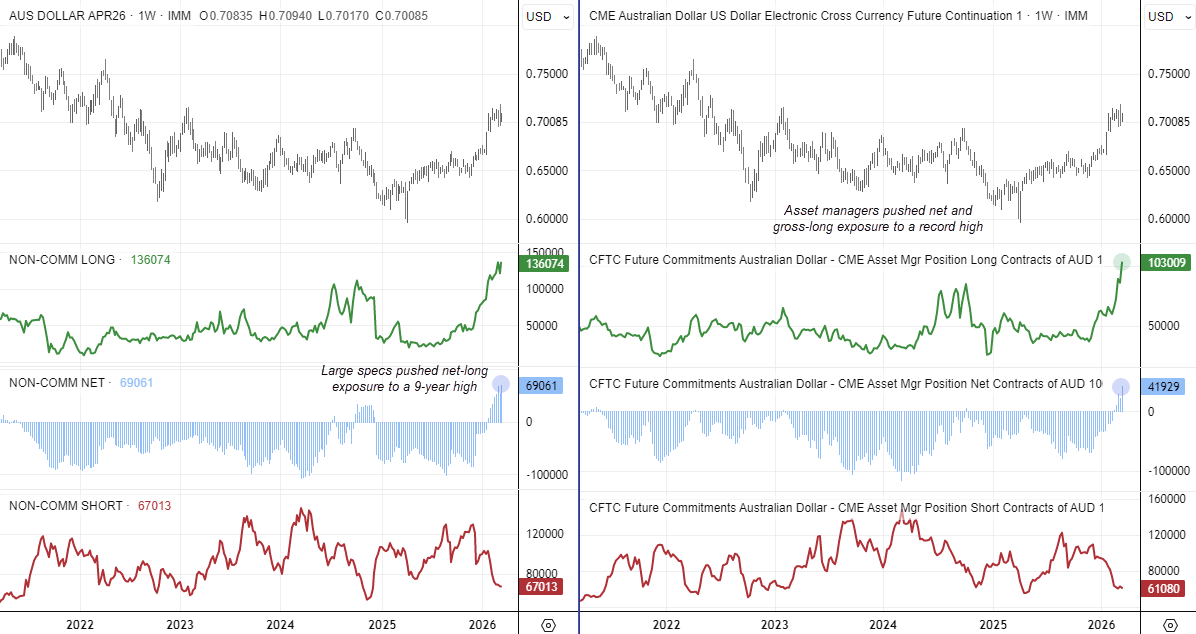
- Asset managers increased their net-long exposure to a record high of 42k contracts.
- What makes this more notable is that 42k contracts long is not extreme in absolute terms, but it is highly unusual for this group.
- Large speculators increased their net-long exposure to a 9-year high of 69k contracts.
- They increased gross longs by 14.7k contracts to 163k, not far from their record high set in 2012.
- Large speculators trimmed net shorts to their lowest level since December 2024.
Source: CFTC, CME, LSEG
AUD/USD Correlations: CNH and NZD Drive the Aussie
- The Chinese yuan (CNH) remains the dominant driver for the Australian dollar, with correlations above 0.8 across all timeframes
- The relationship with the New Zealand dollar has strengthened notably over the past 10 days, with correlation rising to 0.91
- The inverse relationship with the US dollar is also strengthening, with the 10-day correlation at -0.84
- Correlations with gold and copper have weakened, while the 10-day correlation with crude oil has turned sharply negative (-0.75)
- There is no consistent relationship with equity indices based on the current correlation structure
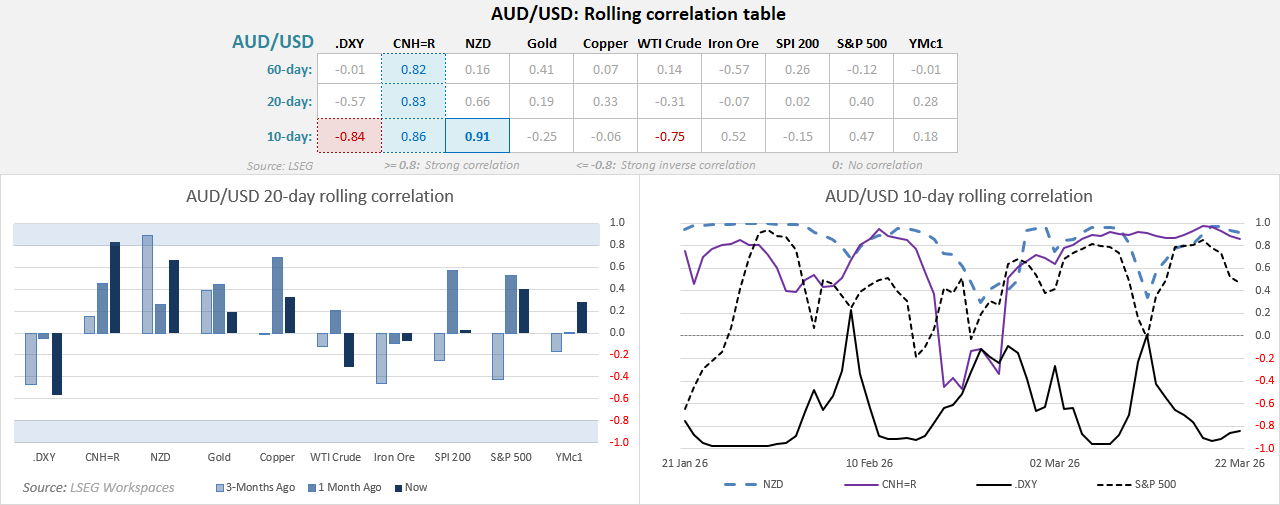
Source: LSEG


Australian Dollar Defies Bearish Options Skew
They call it the battler for good reason, with AUD/USD refusing to roll over despite options traders ramping up downside protection across multiple timeframes. The 1-week 10-delta risk reversal (red line) shows tail risk is firmly skewed towards puts and is on the cusp of reaching its most negative levels since April—when AUD/USD last tested 0.60. The 1-week and 1-month 25-deltas also show institutions are increasingly favouring downside protection.
Hawkish RBA policy expectations remain a key supporting factor for the Aussie. However, if tensions in the Middle East escalate further, we could reach a point where this begins to weigh on the Australian dollar—which is already struggling to break to new highs despite expectations for another RBA hike in May.
A break below 0.6900 likely signals a deeper, risk-off driven pullback. Until then, traders are likely to favour buying dips and extracting what they can from this messy range between 0.6950 and 0.7150.
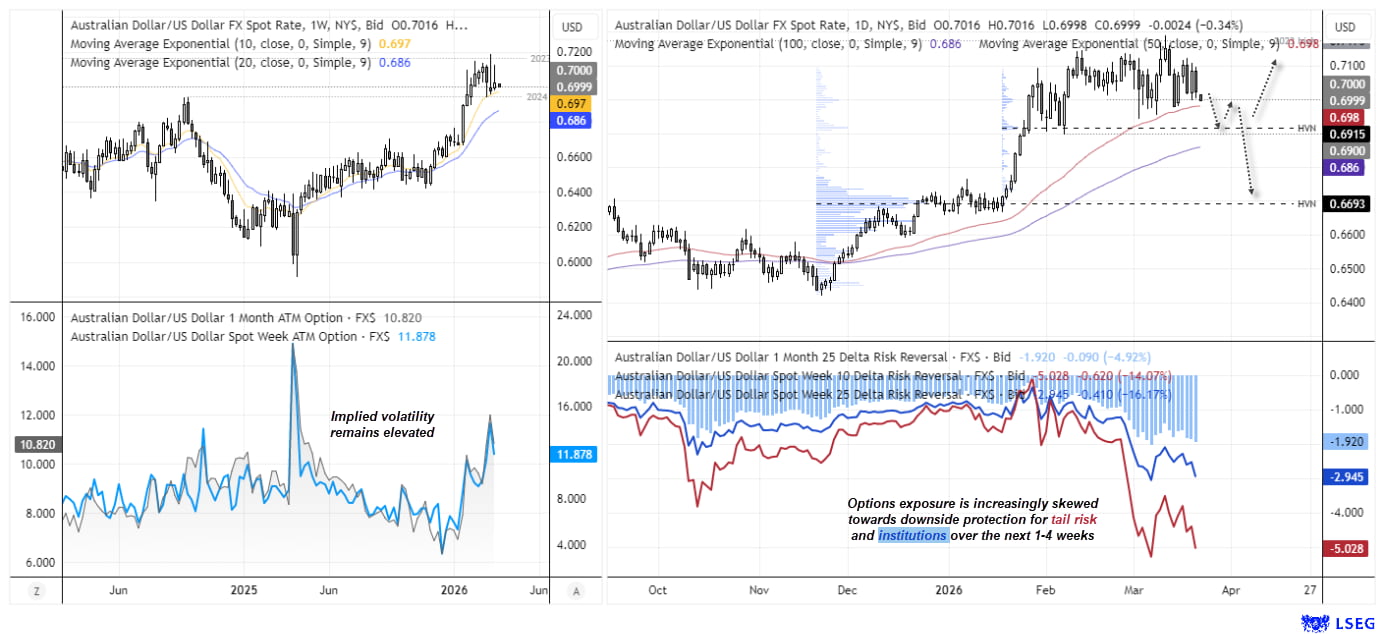
Source: ICE, TradingView
View the full economic calendar
View the full economic calendar
-- Written by Matt Simpson
Follow Matt on Twitter @cLeverEdge
How to trade with City Index
You can trade with City Index by following these four easy steps:
- Open an account, or log in if you’re already a customer
• Open an account in the UK
• Open an account in Australia
• Open an account in Singapore
- Search for the market you want to trade in our award-winning platform
- Choose your position and size, and your stop and limit levels
- Place the trade
Latest market news




Open an account in minutes
Experience award-winning platforms with fast and secure execution, and enjoy tight spreads from 0.5 pts on FX and 0.3 pts on indices.
Economic calendar
Web Trader platform
Our sophisticated web-based platform is packed with features.
Related articles
EUR/USD weekly outlook: FOMC and ECB to set the tone
The current backdrop is modestly bearish. On Friday, the EUR/USD closed modestly lower, down for the third consecutive day. The pair also posted a weekly decline after staging a modest recovery attempt in the previous week. Out of the past 8 weeks, the EUR/USD has fallen on 6 occasions. There is not much supporting factors for the single currency right now. So, the upside remains capped.

USD/JPY Forecast: Is Rising Japanese Inflation Supporting the Yen?
As the trading week comes to an end, one of the most relevant developments in the FX market has been the renewed strength of the Japanese yen. This can be seen in the recent performance of USD/JPY, which has fallen nearly 1.0% over the last two trading sessions, highlighting a meaningful recovery in the Japanese currency against the U.S. dollar.


Australian Dollar Forecast: AUD/USD Support Reversal Sparks Monthly Range Breakout 10 23 2026
A sharp reversal off key support has fueled the AUD/USD recovery, with resistance now in focus ahead of next week’s Fed decision and Australian CPI.

This report is intended for general circulation only. It should not be construed as a recommendation, or an offer (or solicitation of an offer) to buy or sell any financial products. The information provided does not take into account your specific investment objectives, financial situation or particular needs. Before you act on any recommendation that may be contained in this report, independent advice ought to be sought from a financial adviser regarding the suitability of the investment product, taking into account your specific investment objectives, financial situation or particular needs.
StoneX Financial Pte. Ltd., may distribute reports produced by its respective foreign entities or affiliates within the StoneX group of companies or third parties pursuant to an arrangement under Regulation 32C of the Financial Advisers Regulations. Where the report is distributed to a person in Singapore who is not an accredited investor, expert investor or an institutional investor (as defined in the Securities Futures Act), StoneX Financial Pte. Ltd. accepts legal responsibility to such persons for the contents of the report only to the extent required by law. Singapore recipients should contact StoneX Financial Pte. Ltd. at 6826 9988 for matters arising from, or in connection with the report.
In the case of all other recipients of this report, to the extent permitted by applicable laws and regulations neither StoneX Financial Pte. Ltd. nor its associated companies will be responsible or liable for any loss or damage incurred arising out of, or in connection with, any use of the information contained in this report and all such liability is hereby expressly disclaimed. No representation or warranty is made, express or implied, that the content of this report is complete or accurate.
StoneX Financial Pte. Ltd. is not under any obligation to update this report.
Trading CFDs carries a high level of risk that may not be suitable for some investors. Consider your investment objectives, level of experience, financial resources, risk appetite and other relevant circumstances carefully. The possibility exists that you could lose some or all of your investments, including your initial deposits. If in doubt, please seek independent expert advice. Visit www.forex.com/en-sg/terms-and-policies for the complete Risk Disclosure Statement.