


Bitcoin Outlook: It Could Be Now or Never for a BTC Bounce
Bitcoin is holding above $60k despite bearish momentum and geopolitical risks. Seasonality and oversold signals hint a countertrend bounce may be near.
Share this:

I fully understand how this call for a bounce could irk many bears. The trend is clearly lower, the outlook for crypto is murky, and there are genuine concerns that we could be headed towards World War III. While all of this may be true, bitcoin has so far held above $60k despite the negativity.
If a bearish market cannot break support amid bad news, it becomes vulnerable to a bounce should sentiment improve. In fact, we may not even need good news — merely a scaling back of the bad news for a bounce to unfold.
View related analysis:
- Bitcoin Outlook: Is 60k the Bounce Zone or a Trap Door to 50k?
- Bitcoin Rout Stalls as Familiar Retracement Pattern Reappears
- Bitcoin Bears At Risk of Short Squeeze Unless Prices Continue Lower
- The Nasdaq-to-Bitcoin Correlation Is Alive and Well (During Risk-Off)
- AUD/JPY Rattled at 35-Year High, Gold Probes 5000 as Volatility Spikes
Bitcoin Bounce Risk Builds as $60k Support Holds
Source: LSEG
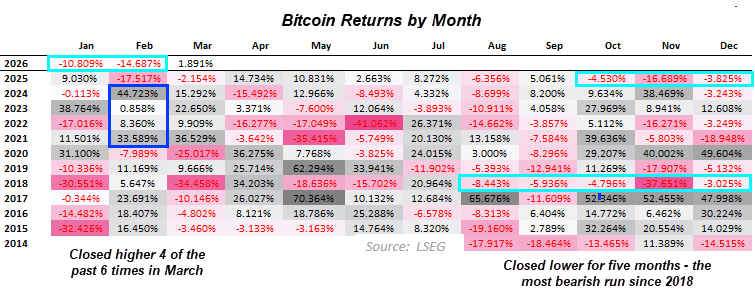
Furthermore, bitcoin has just suffered a five-month decline — its most bearish run since 2018. While this does not exactly scream “buy”, it is another factor to consider when assessing whether the market may be oversold, at least in the near term.
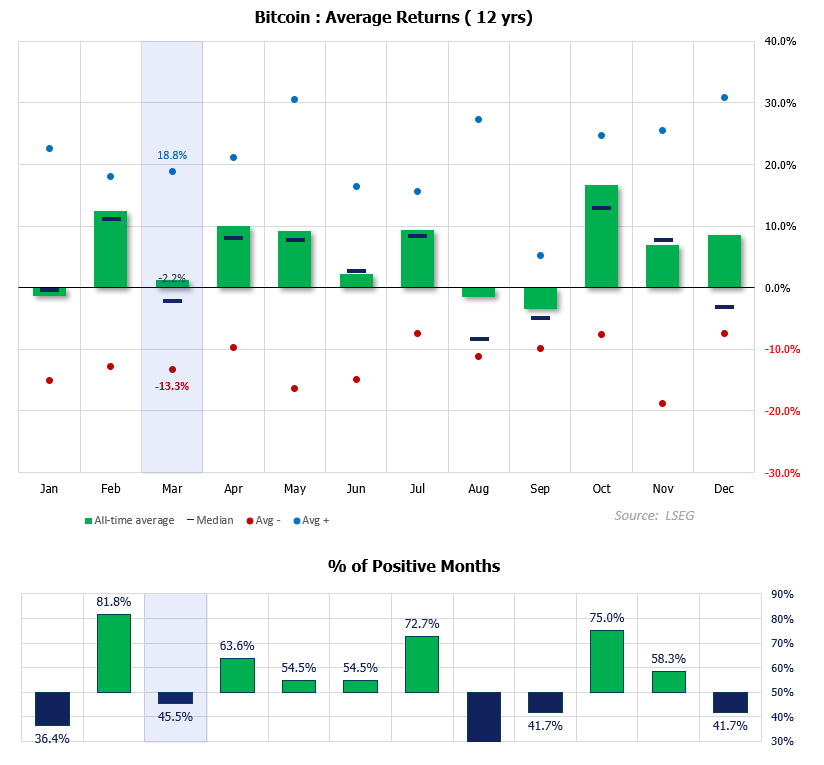
Seasonality also adds an interesting layer. While bitcoin has generated a slight negative median return over the past 12 years, it has closed higher in four of the past six Marchs. Average gains during positive March months have been 18.8%, compared with an average loss of -13.3% during negative months, despite March closing lower 54.5% of the time.
These are not predictions — merely observations of historical behaviour. But with prices still holding above $60k despite the negativity surrounding crypto, a countertrend bounce could remain on the cards so long as support continues to hold.
Source: LSEG


Bitcoin (BTC/USD) Technical Analysis: Bitcoin vs US Dollar
$60k Support Holds as Oversold Signals Hint at Bounce Risk
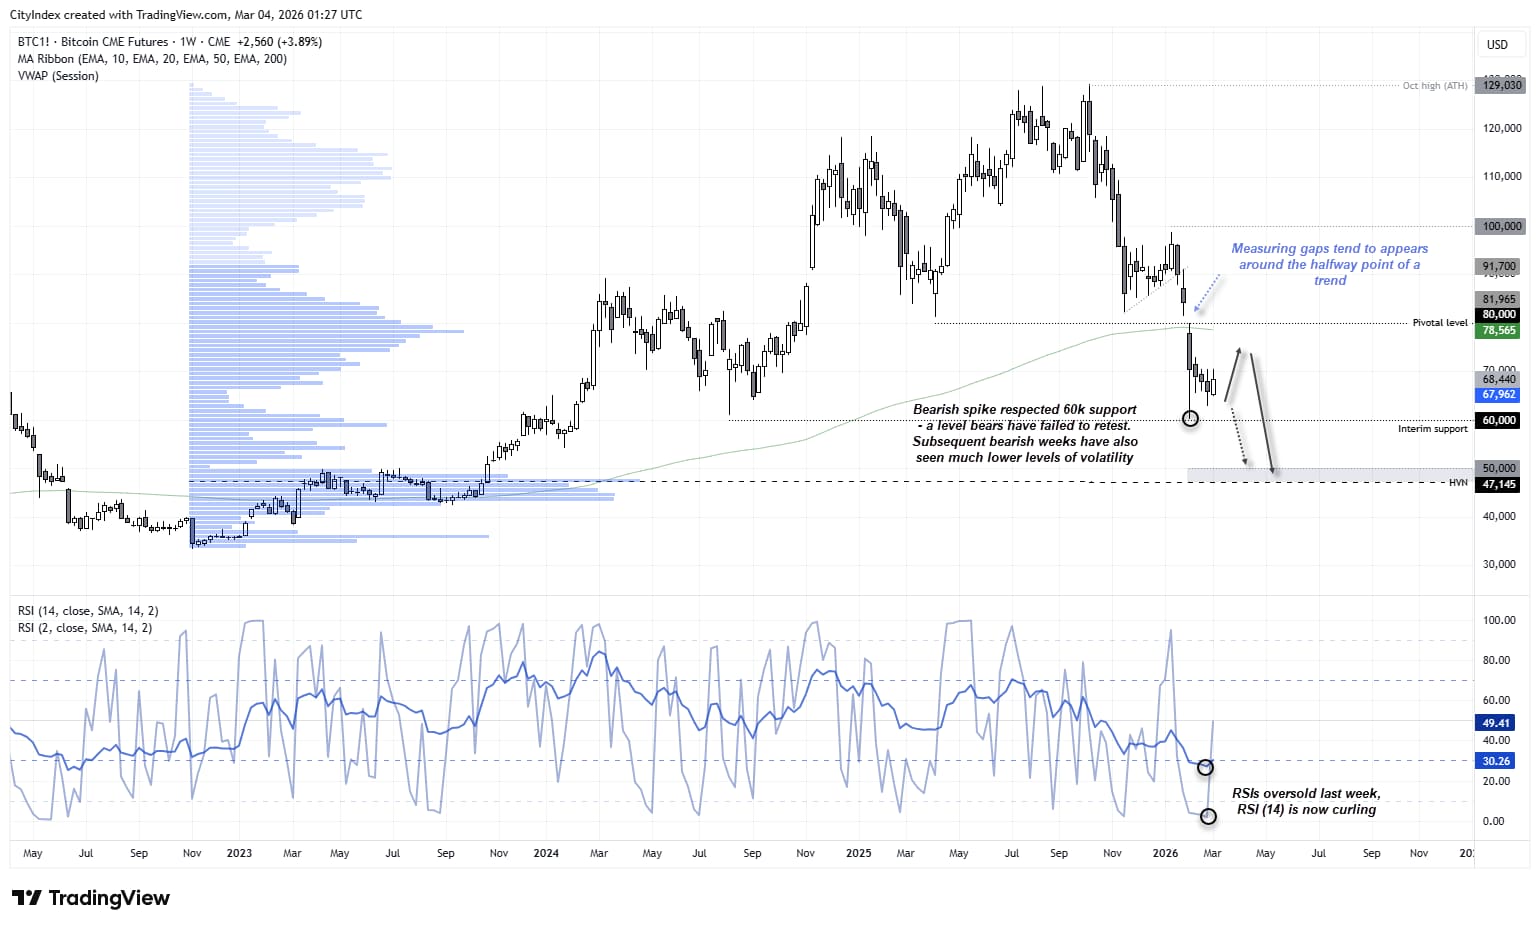
The weekly chart shows strong bearish momentum overall, with the gap below 80,000 highlighting an acceleration of the downtrend. Such gaps are sometimes referred to as “measuring gaps”, as they tend to appear around the midpoint of a move. If that interpretation proves accurate, bitcoin could theoretically fall as low as 30,000.
For now, my core bias remains for a move down to at least 50,000, near the 47,150 high-volume node (HVN). However, there are also clues that a bounce may be in the making on this timeframe.
The spike lower four weeks ago respected 60,000 support. While prices have drifted lower since then, weekly volatility has remained subdued and bears have failed to drive price back to the wick’s low. This suggests the possibility that accumulation is taking place.
Momentum is also attempting to turn higher this week despite the plethora of risk-off headlines — a sign of resilience from bitcoin bulls given the geopolitical backdrop. It is also worth noting that the weekly RSI (2) and RSI (14) both reached oversold territory at last week’s close.
Source: CME, TradingView


$70k Resistance Key as Bulls Attempt to Build Momentum
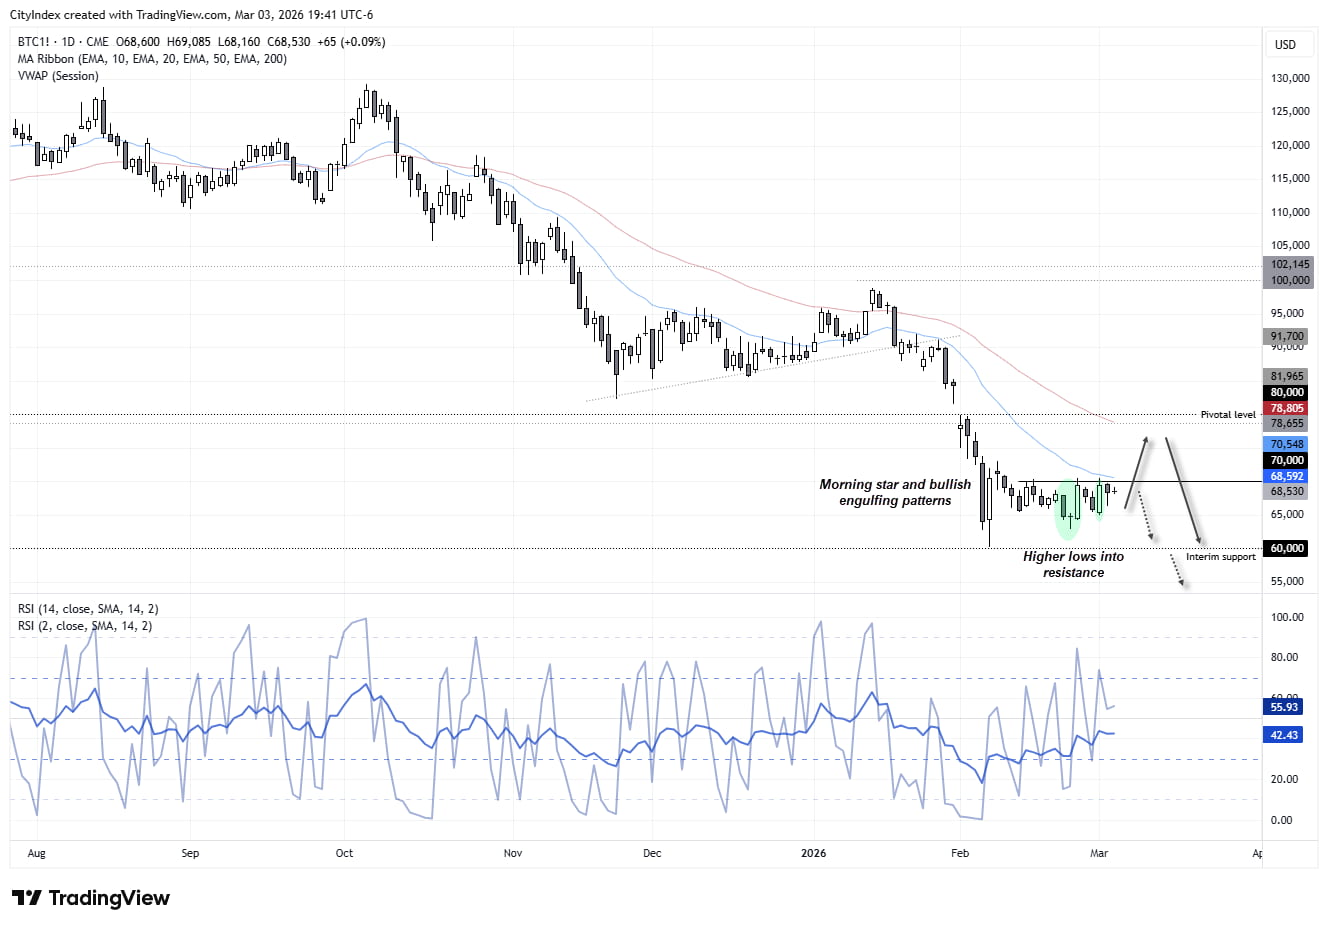
70,000 is a clear line in the sand for bitcoin traders over the near term. While it continues to cap prices as resistance, we have now seen two bullish range-expansion candles, both forming higher lows relative to the 60,000 spike low. To me, this suggests bullish pressure is quietly building, which fits with the idea that accumulation may be taking place.
Tuesday’s hanging man candle warns of near-term downside risks, but my preference is to seek dips within yesterday’s range so long as prices remain above Tuesday’s low near 65,000.
A break above 70,000 could trigger a quick follow-through higher, given the significance of the level and the likelihood that bearish stops may be triggered. The 20-day EMA is currently capping prices as resistance, and a break above it brings the 50-day EMA into focus near the 80,000 level.
Should bulls be treated to a bullish breakout, I will also be watching for evidence of a swing high at or below 80,000 in anticipation of the next leg lower. A break below 60,000 would instead bring the 50,000 handle into focus.
Source: CME, TradingView
View the full economic calendar
View the full economic calendar
-- Written by Matt Simpson
Follow Matt on Twitter @cLeverEdge
How to trade with City Index
You can trade with City Index by following these four easy steps:
- Open an account, or log in if you’re already a customer
• Open an account in the UK
• Open an account in Australia
• Open an account in Singapore
- Search for the market you want to trade in our award-winning platform
- Choose your position and size, and your stop and limit levels
- Place the trade
Related tags:




Open an account in minutes
Experience award-winning platforms with fast and secure execution, and enjoy tight spreads from 0.5 pts on FX and 0.3 pts on indices.
Economic calendar
Web Trader platform
Our sophisticated web-based platform is packed with features.
Related articles

Bitcoin Bulls Eye Weekend Bounce as Nasdaq Finds Support
Bitcoin bulls eye a weekend bounce as Nasdaq finds support, BTC holds $80k and bullish reversal signals emerge alongside stronger correlations.

DAX, Gold and Bitcoin forecast: Dollar falls, yields retreat as risk appetite returns
Markets went from risk off to risk on yesterday afternoon and we have since kicked on with some follow-up buying of stocks, gold and silver, while the dollar has also shown signs of weakness. Risk appetite turned positive after bond yields and oil prices both retreated yesterday.


Gold Dips Below Three-Month Uptrend, Bitcoin Pulls Back from Nine-Month High
Gold has dipped below its three-month uptrend, while Bitcoin has pulled back from a nine-month high as U.S. bond yields test levels last seen in 2004 and 2007. Risks build as Fed rate-hike expectations remain above 70%, while the Dollar Index holds near yearly highs.

This report is intended for general circulation only. It should not be construed as a recommendation, or an offer (or solicitation of an offer) to buy or sell any financial products. The information provided does not take into account your specific investment objectives, financial situation or particular needs. Before you act on any recommendation that may be contained in this report, independent advice ought to be sought from a financial adviser regarding the suitability of the investment product, taking into account your specific investment objectives, financial situation or particular needs.
StoneX Financial Pte. Ltd., may distribute reports produced by its respective foreign entities or affiliates within the StoneX group of companies or third parties pursuant to an arrangement under Regulation 32C of the Financial Advisers Regulations. Where the report is distributed to a person in Singapore who is not an accredited investor, expert investor or an institutional investor (as defined in the Securities Futures Act), StoneX Financial Pte. Ltd. accepts legal responsibility to such persons for the contents of the report only to the extent required by law. Singapore recipients should contact StoneX Financial Pte. Ltd. at 6826 9988 for matters arising from, or in connection with the report.
In the case of all other recipients of this report, to the extent permitted by applicable laws and regulations neither StoneX Financial Pte. Ltd. nor its associated companies will be responsible or liable for any loss or damage incurred arising out of, or in connection with, any use of the information contained in this report and all such liability is hereby expressly disclaimed. No representation or warranty is made, express or implied, that the content of this report is complete or accurate.
StoneX Financial Pte. Ltd. is not under any obligation to update this report.
Trading CFDs carries a high level of risk that may not be suitable for some investors. Consider your investment objectives, level of experience, financial resources, risk appetite and other relevant circumstances carefully. The possibility exists that you could lose some or all of your investments, including your initial deposits. If in doubt, please seek independent expert advice. Visit www.forex.com/en-sg/terms-and-policies for the complete Risk Disclosure Statement.