



Bitcoin Bears At Risk of Short Squeeze Unless Prices Continue Lower
Volume and momentum suggest Bitcoin bears are pressing shorts near key support, but failure to break lower risks a sharp short squeeze rebound.
Share this:

Bitcoin futures remain under pressure following a steep two-week sell-off from record highs. Yet, despite growing bearish positioning, the market continues to hold key technical levels near the 200-day EMA — setting up a potential battleground between bears seeking continuation and those wary of a short squeeze.
View related analysis:
View related analysis:
Bitcoin Futures Analysis: Bears Risk Short Squeeze as Downtrend Momentum Slows
Bitcoin’s Triple Top Signals Potential for Deeper Correction
A couple of weeks ago, I noted the triple top on the Bitcoin futures weekly chart. When combined with steadily declining volume and a multi-month bearish RSI divergence, it reeks of a market top. And when we consider that it has only fallen 18% over the past two weeks—compared with the two prior corrections of around 32%—I suspect Bitcoin could at least retest 100k and possibly retrace deeper.
It’s also worth noting that Bitcoin has just suffered its worst two-week period in 13 months. While the two-week decline in September 2024 marked a cycle low, the fact that we’ve now seen a sharp reversal of sentiment at a record high leans more towards its cycle higher than the beginning.
However, before we get too bearish too soon, bears must first conquer a key support zone between the 100k handle and the June low (102,145). Perhaps the support zone could mark the end of the initial wave lower in an ABC correction, prompting a bounce higher before an eventual break lower. For comparison, a 32% decline from the record high — similar to the two prior corrections — would project to just below 89,000.
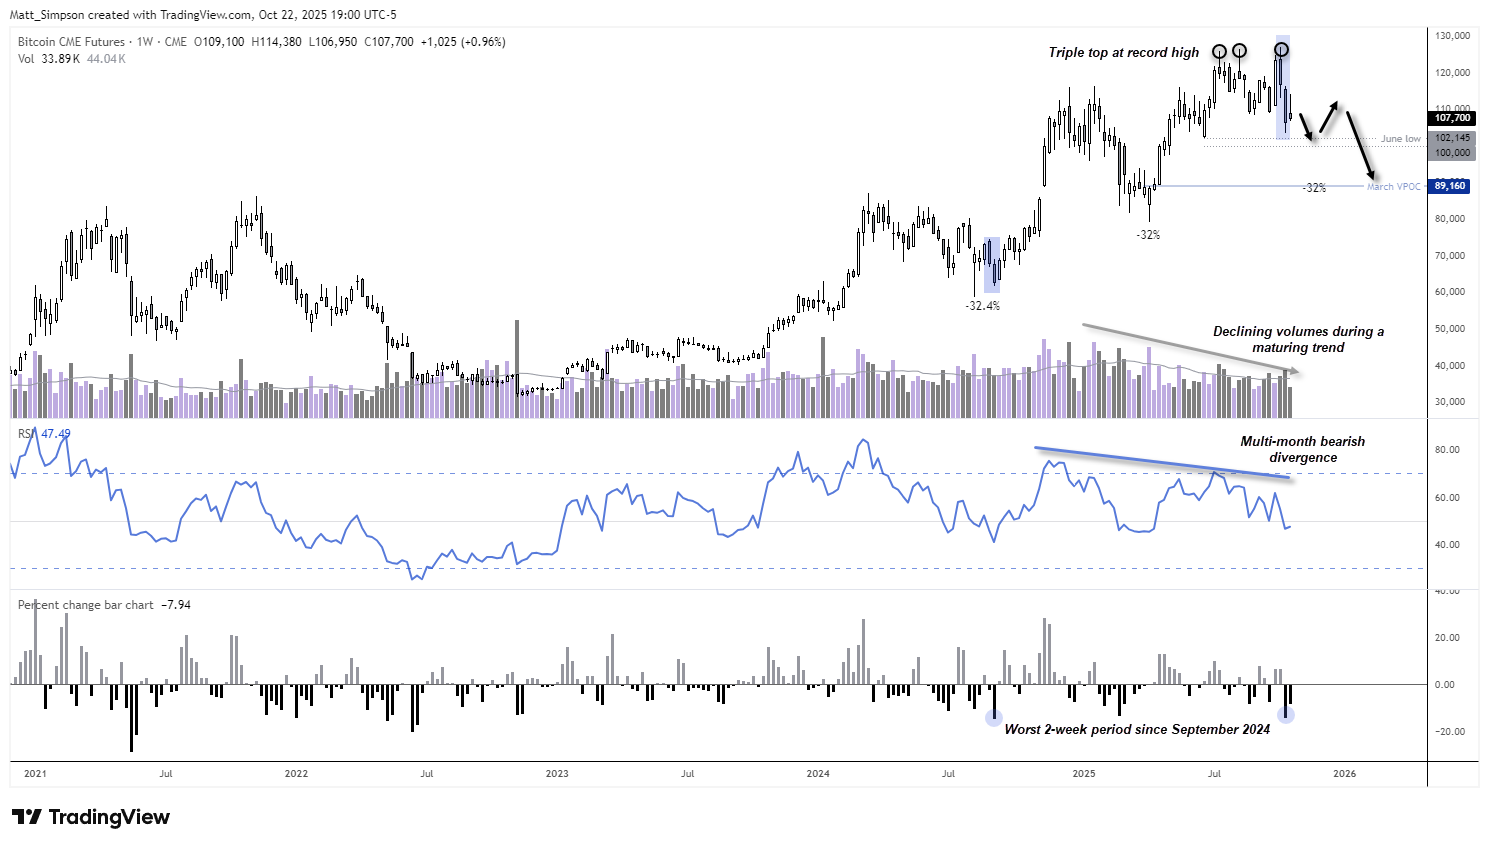
Chart analysis by Matt Simpson - data source: TradingView Bitcoin CME Futures (BTC1!)
Bitcoin Futures Daily Chart: Bears Press Shorts, Though Short-Squeeze Risk Builds
The daily timeframe shows that the sharp drop from Bitcoin’s all-time high (ATH) occurred in a single, straight line. Momentum has also realigned with that bearish move following a two-day bounce, with a three-bar bearish reversal (evening star pattern) likely appealing further to bears. Moreover, cumulative volume delta (CVD) has continued to trend lower ahead of prices, indicating that offers (sell orders) continue to outnumber bids (buy orders).
Bears are essentially front-running an anticipated leg lower. However, the longer Bitcoin prices refrain from breaking last week’s swing low, the more nervous these pre-emptive bears may become—potentially prompting some to cover their shorts and inadvertently lift prices higher. It’s also worth noting that prices are currently holding above the 200-day EMA.


Ultimately, prices need to move lower quickly to avoid a short-covering rally. And with the 200-day EMA in play, there’s potential for a higher low to form over the near term. Bears may therefore wish to wait for a break of the 200-day EMA or seek evidence of a lower high (swing high) following a bounce from current levels before initiating new short positions.
Either way, my bias remains for a retest of 100k, near the 98,690 high-volume node (HVN). A break beneath the 97,520 lows near the 61.8% Fibonacci level would assume a deeper correction, bringing 90k into focus near the March VPOC and the –32% retracement level from its record high.
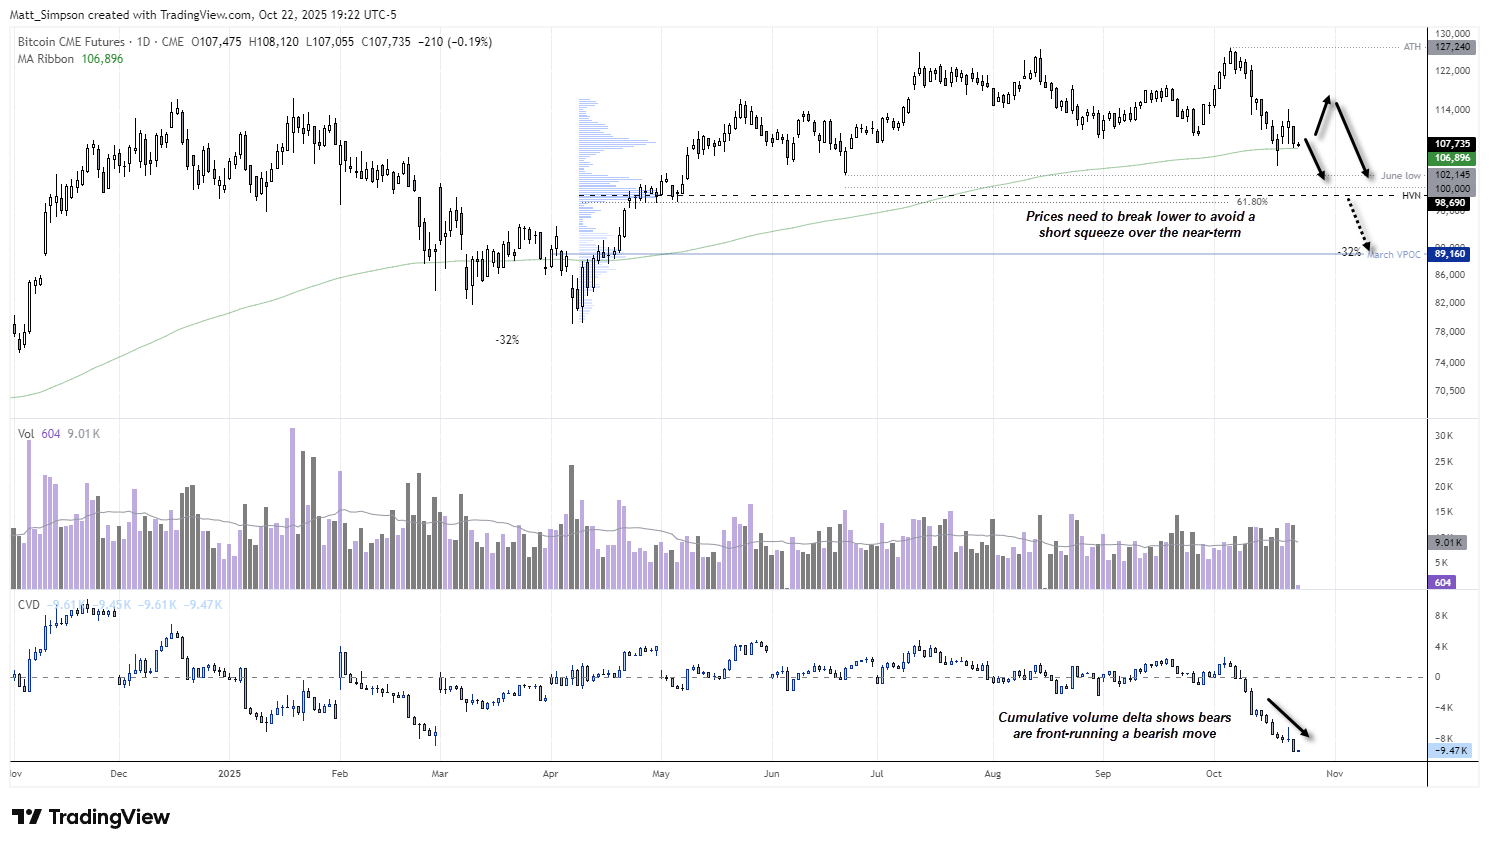
Chart analysis by Matt Simpson - data source: TradingView Bitcoin CME Futures (BTC1!)
View the full economic calendar
View the full economic calendar
-- Written by Matt Simpson
Follow Matt on Twitter @cLeverEdge
How to trade with City Index
You can trade with City Index by following these four easy steps:
- Open an account, or log in if you’re already a customer
• Open an account in the UK
• Open an account in Australia
• Open an account in Singapore
- Search for the market you want to trade in our award-winning platform
- Choose your position and size, and your stop and limit levels
- Place the trade
Related tags:




Open an account in minutes
Experience award-winning platforms with fast and secure execution, and enjoy tight spreads from 0.5 pts on FX and 0.3 pts on indices.
Economic calendar
Web Trader platform
Our sophisticated web-based platform is packed with features.
Related articles

Silver forecast: metals liquidation drags XAG/USD into $50-55 support
Silver has broken its July low and slipped into a long-term support zone as the selling in precious metals deepens. The chart shows where the metal could bottom, and next week's Fed decision may decide whether it does.


S&P 500 forecast: AI linked stocks remain under pressure
And just like that, it is Friday again and the end of a volatile week. Today offers little on the macro calendar to change the prevailing narrative, leaving markets largely at the mercy of risk appetite, oil prices and the growing unease around the AI trade.

Nasdaq 100 Slides as Meta Posts Strong Results and Drops 6%
The Nasdaq 100 sell-off is being driven by doubts over AI spending, as investors punish strong earnings that fail to justify stretched valuations.
This report is intended for general circulation only. It should not be construed as a recommendation, or an offer (or solicitation of an offer) to buy or sell any financial products. The information provided does not take into account your specific investment objectives, financial situation or particular needs. Before you act on any recommendation that may be contained in this report, independent advice ought to be sought from a financial adviser regarding the suitability of the investment product, taking into account your specific investment objectives, financial situation or particular needs.
StoneX Financial Pte. Ltd., may distribute reports produced by its respective foreign entities or affiliates within the StoneX group of companies or third parties pursuant to an arrangement under Regulation 32C of the Financial Advisers Regulations. Where the report is distributed to a person in Singapore who is not an accredited investor, expert investor or an institutional investor (as defined in the Securities Futures Act), StoneX Financial Pte. Ltd. accepts legal responsibility to such persons for the contents of the report only to the extent required by law. Singapore recipients should contact StoneX Financial Pte. Ltd. at 6826 9988 for matters arising from, or in connection with the report.
In the case of all other recipients of this report, to the extent permitted by applicable laws and regulations neither StoneX Financial Pte. Ltd. nor its associated companies will be responsible or liable for any loss or damage incurred arising out of, or in connection with, any use of the information contained in this report and all such liability is hereby expressly disclaimed. No representation or warranty is made, express or implied, that the content of this report is complete or accurate.
StoneX Financial Pte. Ltd. is not under any obligation to update this report.
Trading CFDs carries a high level of risk that may not be suitable for some investors. Consider your investment objectives, level of experience, financial resources, risk appetite and other relevant circumstances carefully. The possibility exists that you could lose some or all of your investments, including your initial deposits. If in doubt, please seek independent expert advice. Visit www.forex.com/en-sg/terms-and-policies for the complete Risk Disclosure Statement.