


Bitcoin Rout Stalls as Familiar Retracement Pattern Reappears
Bitcoin hits the 90k support zone again as a familiar retracement pattern returns. A near-term low may form, but broader risks remain.
Share this:

The bearish Bitcoin target around 90k that I outlined in early October was reached on Wednesday. It wasn’t the easiest target to set, given it required a break below the key 100k level and came with plenty of verbal pushback from bulls along the way. But it felt as though the tide had turned, with Wall Street also under pressure and cryptocurrencies generally pricing in more bad news than good.
View related analysis:
View related analysis:
The 90k level wasn’t picked out of thin air. It sits near the March volume point of control (VPOC), and it marks a -32% correction from the high — matching the depth of the previous two retracements. I can’t claim to understand why 32% matters to Bitcoin traders, but it does appear to be a pattern nonetheless.
This now puts Bitcoin at a potential inflection point. It also raises the question of whether we’ll see a solid rebound back to record highs — as we did after the August 2024 and April 2025 lows — or whether bears still have more to deliver. Either way, I suspect a near-term low is close before the market decides its next directional move.


Bitcoin Pullback Holds at a Key Retracement Zone
Bitcoin Technical Overview: BTC/USD at a Monthly Turning Point
We still have ten calendar days left in the month, but Bitcoin futures are on track for their worst month in nine. Even if prices recover into month-end — which I suspect they will — November has already been the most volatile in at least seven months.
A triple top has formed on the monthly chart within a relatively tight range, and November’s bearish range-expansion candle suggests Bitcoin’s broader pullback may have further to run once the anticipated bounce has played out.
The weekly chart shows a heavily oversold RSI (2) to warn of a near term inflection point, though the RSI (14) remains bearish without being oversold and continues to point lower.
AI doubt bitcoin will make it to 100k but it is an obvious resistance area to consider and lull bulls into a false breakout. Ultimately, a move down to the April low (79,785) could be the next target for bears, ahead of 70k near the 200-week SMA, should the wheels truly fall off.
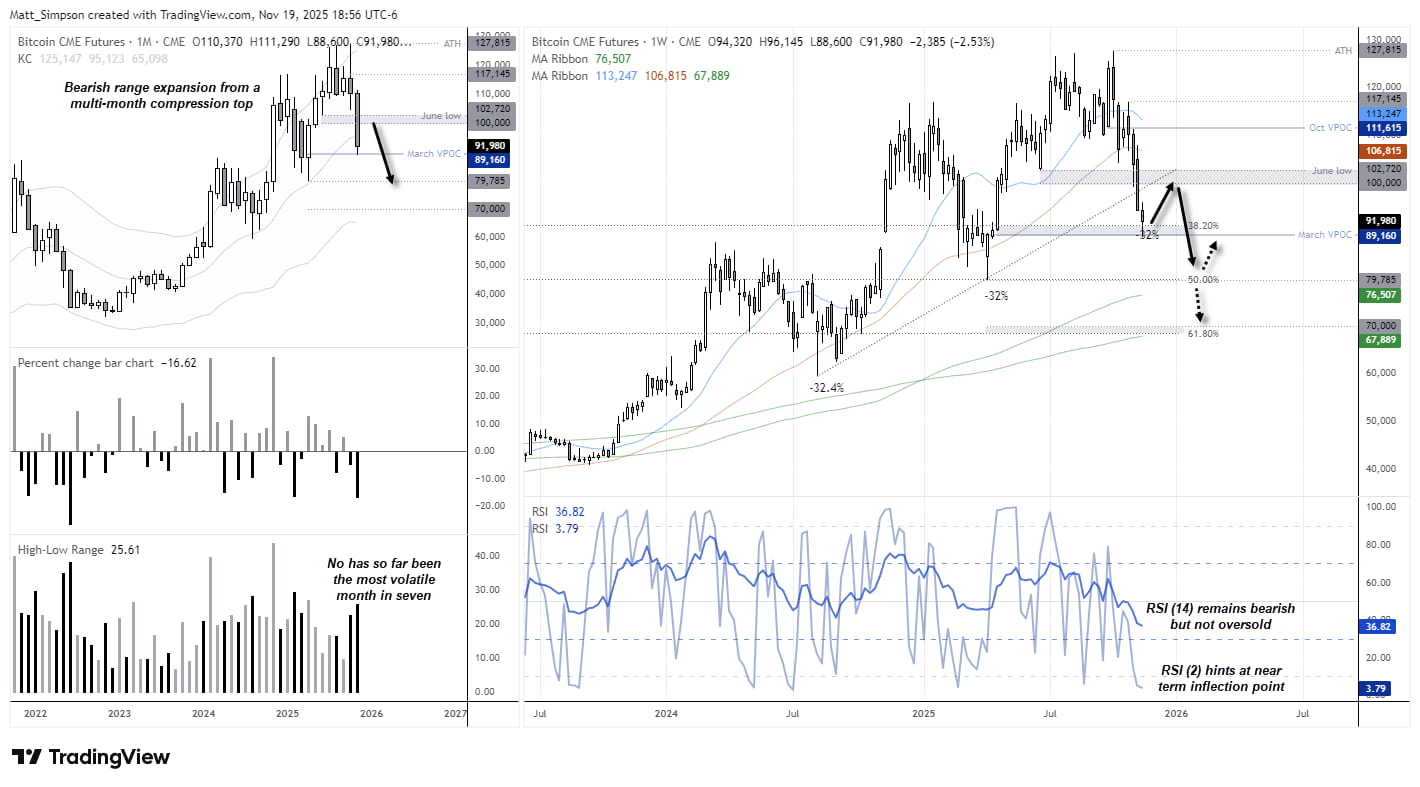
Chart analysis by Matt Simpson - data source: TradingView Bitcoin CME Futures (BTC1!)
Bitcoin Correlations
It’s worth remembering that Bitcoin maintains a strong correlation with broader Wall Street sentiment — particularly tech. Another earnings beat and upbeat outlook from Nvidia (NVDA) after Wednesday’s close helped BTC futures climb roughly 3% during a quiet Asian session. The 10-, 20- and 60-day data all show firm positive correlations with the Nasdaq, S&P 500 and SOX (semiconductor index). While the correlation with Nvidia itself is slightly weaker on the shorter windows, the relationship is still clearly supportive.
Given my bearish outlook for both Nvidia and the Nasdaq 100, this strengthens the case that Bitcoin’s bears may have more room to push.
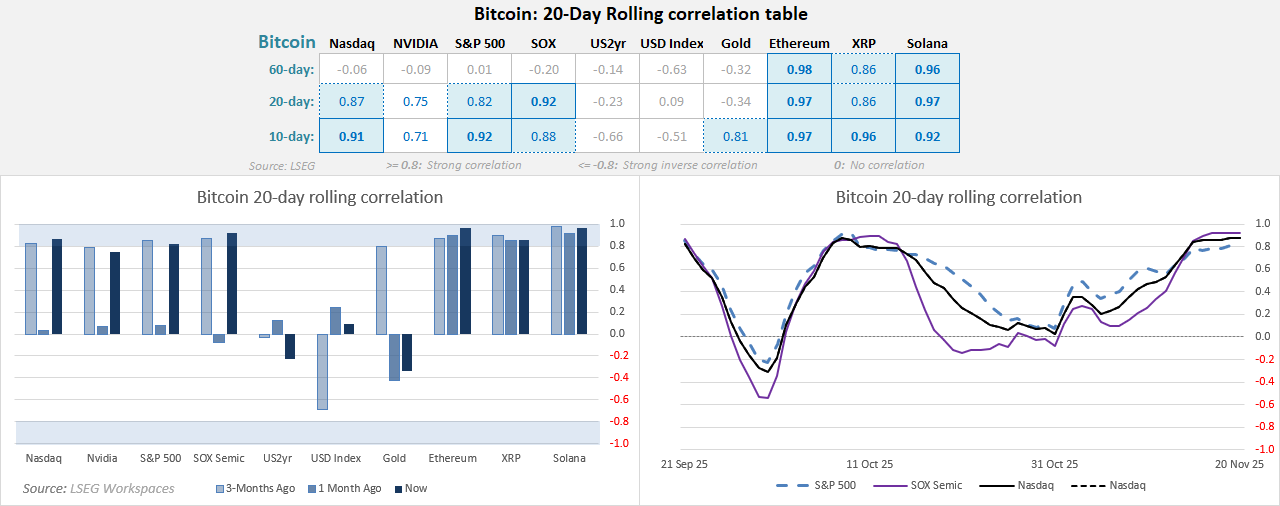
Charts prepared by Matt Simpson, Source: CME, LSEG
View the full economic calendar
View the full economic calendar
-- Written by Matt Simpson
Follow Matt on Twitter @cLeverEdge
How to trade with City Index
You can trade with City Index by following these four easy steps:
- Open an account, or log in if you’re already a customer
• Open an account in the UK
• Open an account in Australia
• Open an account in Singapore
- Search for the market you want to trade in our award-winning platform
- Choose your position and size, and your stop and limit levels
- Place the trade
Related tags:




Open an account in minutes
Experience award-winning platforms with fast and secure execution, and enjoy tight spreads from 0.5 pts on FX and 0.3 pts on indices.
Economic calendar
Web Trader platform
Our sophisticated web-based platform is packed with features.
Related articles

Japanese Yen Surges Across FX Majors as Risk Aversion Intensifies
Safe-haven demand sent the Japanese yen higher across FX majors, while USD/JPY broke lower ahead of Japan's CPI release and next week's BOJ meeting.

DJIA and Bitcoin Outlook: Are Charts Facing Contrarian Sentiment Risks?
Risk sentiment has fallen into the extreme-fear zone, sparking contrarian interest and potential dip-buying opportunities. This comes as geopolitical tensions rise again and US bond yields pull back from extreme momentum conditions.


Bitcoin Bulls Eye Weekend Bounce as Nasdaq Finds Support
Bitcoin bulls eye a weekend bounce as Nasdaq finds support, BTC holds $80k and bullish reversal signals emerge alongside stronger correlations.
This report is intended for general circulation only. It should not be construed as a recommendation, or an offer (or solicitation of an offer) to buy or sell any financial products. The information provided does not take into account your specific investment objectives, financial situation or particular needs. Before you act on any recommendation that may be contained in this report, independent advice ought to be sought from a financial adviser regarding the suitability of the investment product, taking into account your specific investment objectives, financial situation or particular needs.
StoneX Financial Pte. Ltd., may distribute reports produced by its respective foreign entities or affiliates within the StoneX group of companies or third parties pursuant to an arrangement under Regulation 32C of the Financial Advisers Regulations. Where the report is distributed to a person in Singapore who is not an accredited investor, expert investor or an institutional investor (as defined in the Securities Futures Act), StoneX Financial Pte. Ltd. accepts legal responsibility to such persons for the contents of the report only to the extent required by law. Singapore recipients should contact StoneX Financial Pte. Ltd. at 6826 9988 for matters arising from, or in connection with the report.
In the case of all other recipients of this report, to the extent permitted by applicable laws and regulations neither StoneX Financial Pte. Ltd. nor its associated companies will be responsible or liable for any loss or damage incurred arising out of, or in connection with, any use of the information contained in this report and all such liability is hereby expressly disclaimed. No representation or warranty is made, express or implied, that the content of this report is complete or accurate.
StoneX Financial Pte. Ltd. is not under any obligation to update this report.
Trading CFDs carries a high level of risk that may not be suitable for some investors. Consider your investment objectives, level of experience, financial resources, risk appetite and other relevant circumstances carefully. The possibility exists that you could lose some or all of your investments, including your initial deposits. If in doubt, please seek independent expert advice. Visit www.forex.com/en-sg/terms-and-policies for the complete Risk Disclosure Statement.