




Crude Oil Analysis: WTI Hovers Around $60 Amid Global Demand Uncertainty
WTI crude has dropped more than 18% over the past seven trading sessions, and the strong bearish bias has remained intact.
Share this:

WTI crude has dropped more than 18% over the past seven trading sessions, and the strong bearish bias has remained intact. This decline has been driven by growing concerns around the ongoing trade war, which has weighed on global economic growth expectations and, in turn, kept oil demand projections suppressed. As the trade conflict escalates, downward pressure on WTI is likely to remain dominant in the sessions ahead.
Demand Outlook Weakens
The new trade war has played a central role in recent movements in oil prices. In recent days, it was confirmed that the United States imposed a 145% tariff on all goods imported from China, effective immediately. In response, China announced a 125% tariff on U.S. goods, scheduled to take effect in the coming days. Furthermore, the Chinese government stated that it will disregard any future threats from the White House.
This escalation marks a major turning point in the trade conflict, as two of the world’s largest economies are actively seeking to disrupt each other’s economic activity. This situation not only affects the U.S. and China, but also clouds the global economic growth outlook, which is heavily tied to the performance of both nations.
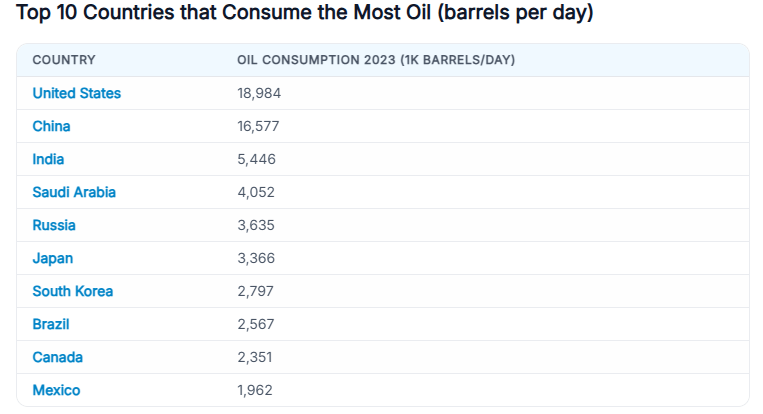
According to the latest 2023 data, the U.S. and China remain the world’s two largest oil consumers, with daily demand of 18.98 million and 16.57 million barrels, respectively.
Source: Worldpopulationreview
In this scenario, a decline in economic activity in both countries—driven by tariffs—could significantly impact global oil demand. Reduced economic output generally translates into lower consumption of raw materials, particularly oil. Reflecting this, the International Energy Agency (IEA) has already lowered its global demand growth forecast for the year, from 1.2 million to 900,000 barrels per day. This revision has been a key factor behind the sharp decline in oil market confidence during recent sessions.
On the supply side, OPEC+ has started to implement its plan to increase production. In early April, the organization announced an upcoming production increase of 411,000 barrels per day, starting in May, citing the need to ease restrictions after several years of limited output among member nations.
As a result, the market faces a dual headwind: weakening global demand, due to the economic slowdown in the U.S. and China, and rising supply driven by OPEC+ decisions. This combination could reinforce the bearish outlook for oil prices in the short term.
WTI Technical Outlook

Source: StoneX, Tradingview
- Emerging Downtrend: Recent bearish swings have started to form a new descending trendline, beginning in mid-January. Currently, selling pressure has brought prices down to $60 per barrel zone. However, due to the speed of the recent drop, the market could experience short-term corrective rebounds. For now, this new bearish trend remains the most relevant formation to monitor.
- RSI: The RSI line continues to reflect bearish momentum, remaining below the neutral 50 level. However, the indicator is now approaching oversold territory, which may suggest an imbalance in market forces and open the door to technical rebounds in the coming sessions.
- MACD: The MACD line, its signal line, and the histogram all remain below the zero level, indicating that recent momentum is still bearish. As MACD continues to move lower, this may point to a further consolidation of selling pressure in the short term.
Key Levels:
- $55 – Critical Support: This level coincides with a zone of historical neutrality last seen in 2019. A clear break below it could trigger a deeper bearish trend.
- $66 – Near Resistance: Represents the consolidation zone from the previous broad lateral range. It may serve as a potential area for short-term bullish corrections.
- $71 – Major Resistance: Aligned with the 200-period simple moving average. A return to this level could pose a threat to the current bearish structure on the chart.
Written by Julian Pineda, CFA – Market Analyst
Related tags:




Open an account in minutes
Experience award-winning platforms with fast and secure execution, and enjoy tight spreads from 0.5 pts on FX and 0.3 pts on indices.
Economic calendar
Web Trader platform
Our sophisticated web-based platform is packed with features.
Related articles

Gold Price Forecast: XAU/USD Plunges 12.4% Toward Critical Support 10 1 2026
Softer inflation has revived expectations for a Fed pause, but Friday’s payrolls could put gold’s recovery prospects to the test.


Treasury Yields Lose Momentum as Energy ETF Retreats
The 10-year Treasury yield is testing a resistance zone respected since the 1920s, as bearish RSI divergence signals fading upside momentum.


Crude Oil Q4 2026 Outlook: Will a New Energy-Security Regime Emerge?
Crude Oil Q4 2026 Outlook: The U.S.-Iran conflict has done more than disrupt oil flows. It has challenged many of the assumptions underpinning the global energy security system established after the 1973 oil embargo.
This report is intended for general circulation only. It should not be construed as a recommendation, or an offer (or solicitation of an offer) to buy or sell any financial products. The information provided does not take into account your specific investment objectives, financial situation or particular needs. Before you act on any recommendation that may be contained in this report, independent advice ought to be sought from a financial adviser regarding the suitability of the investment product, taking into account your specific investment objectives, financial situation or particular needs.
StoneX Financial Pte. Ltd., may distribute reports produced by its respective foreign entities or affiliates within the StoneX group of companies or third parties pursuant to an arrangement under Regulation 32C of the Financial Advisers Regulations. Where the report is distributed to a person in Singapore who is not an accredited investor, expert investor or an institutional investor (as defined in the Securities Futures Act), StoneX Financial Pte. Ltd. accepts legal responsibility to such persons for the contents of the report only to the extent required by law. Singapore recipients should contact StoneX Financial Pte. Ltd. at 6826 9988 for matters arising from, or in connection with the report.
In the case of all other recipients of this report, to the extent permitted by applicable laws and regulations neither StoneX Financial Pte. Ltd. nor its associated companies will be responsible or liable for any loss or damage incurred arising out of, or in connection with, any use of the information contained in this report and all such liability is hereby expressly disclaimed. No representation or warranty is made, express or implied, that the content of this report is complete or accurate.
StoneX Financial Pte. Ltd. is not under any obligation to update this report.
Trading CFDs carries a high level of risk that may not be suitable for some investors. Consider your investment objectives, level of experience, financial resources, risk appetite and other relevant circumstances carefully. The possibility exists that you could lose some or all of your investments, including your initial deposits. If in doubt, please seek independent expert advice. Visit www.forex.com/en-sg/terms-and-policies for the complete Risk Disclosure Statement.