



Crude Oil Price Outlook: UAE Exits OPEC, Hormuz Weighs on FOMC
Crude Oil Price Outlook: The UAE announces its exit from OPEC and OPEC+ effective May 1st, as tensions around the Strait of Hormuz continue to shape global energy market dynamics alongside central bank outlooks.
Share this:

The UAE announces its exit from OPEC and OPEC+ effective May 1st, as tensions around the Strait of Hormuz continue to shape global energy market dynamics alongside central bank outlooks.
The UAE’s decision reflects a strategic shift that has been building over the past decade, where positioning, capacity expansion, and economic recovery from one of the largest energy shocks in modern history have become key priorities. This comes as the US–Iran conflict moves closer to potential resolution, while the UAE has indicated it will continue to respect broader global production levels.
Market Reaction: Limited Pullback, Structural Support Remains
The UAE’s exit marks a notable step in the global energy landscape and may open the door for other producers to consider a more independent approach as economies navigate the ongoing energy shock linked to the Strait of Hormuz. Crude prices initially dropped by around 3% following the announcement but remain supported near the $100 mark, with Hormuz-related risks continuing to dominate the near-term outlook.
A Shift Toward Flexible, Market-Driven Energy Strategies?
Structurally, the market may be shifting toward more independent, growth-focused energy strategies, where countries prioritize capacity, revenue, and flexibility over coordinated quotas—raising volatility expectations across markets.
FOMC Outlook and Mega-Cap Earnings
The severity of the Hormuz disruption is adding significant weight to the FOMC outlook, as inflation pressures remain elevated above central bank targets, lifting the dollar and bond yields, and pressuring risk assets and precious metals. Latest analysis: Gold, Silver Price Outlook: Bearish Bias Builds Ahead of FOMC
On the earnings front, any disappointment, particularly around AI monetization or broader revenue trends, may be amplified by rising macro risks, driven by elevated energy prices and ongoing supply disruptions linked to the Strait of Hormuz.
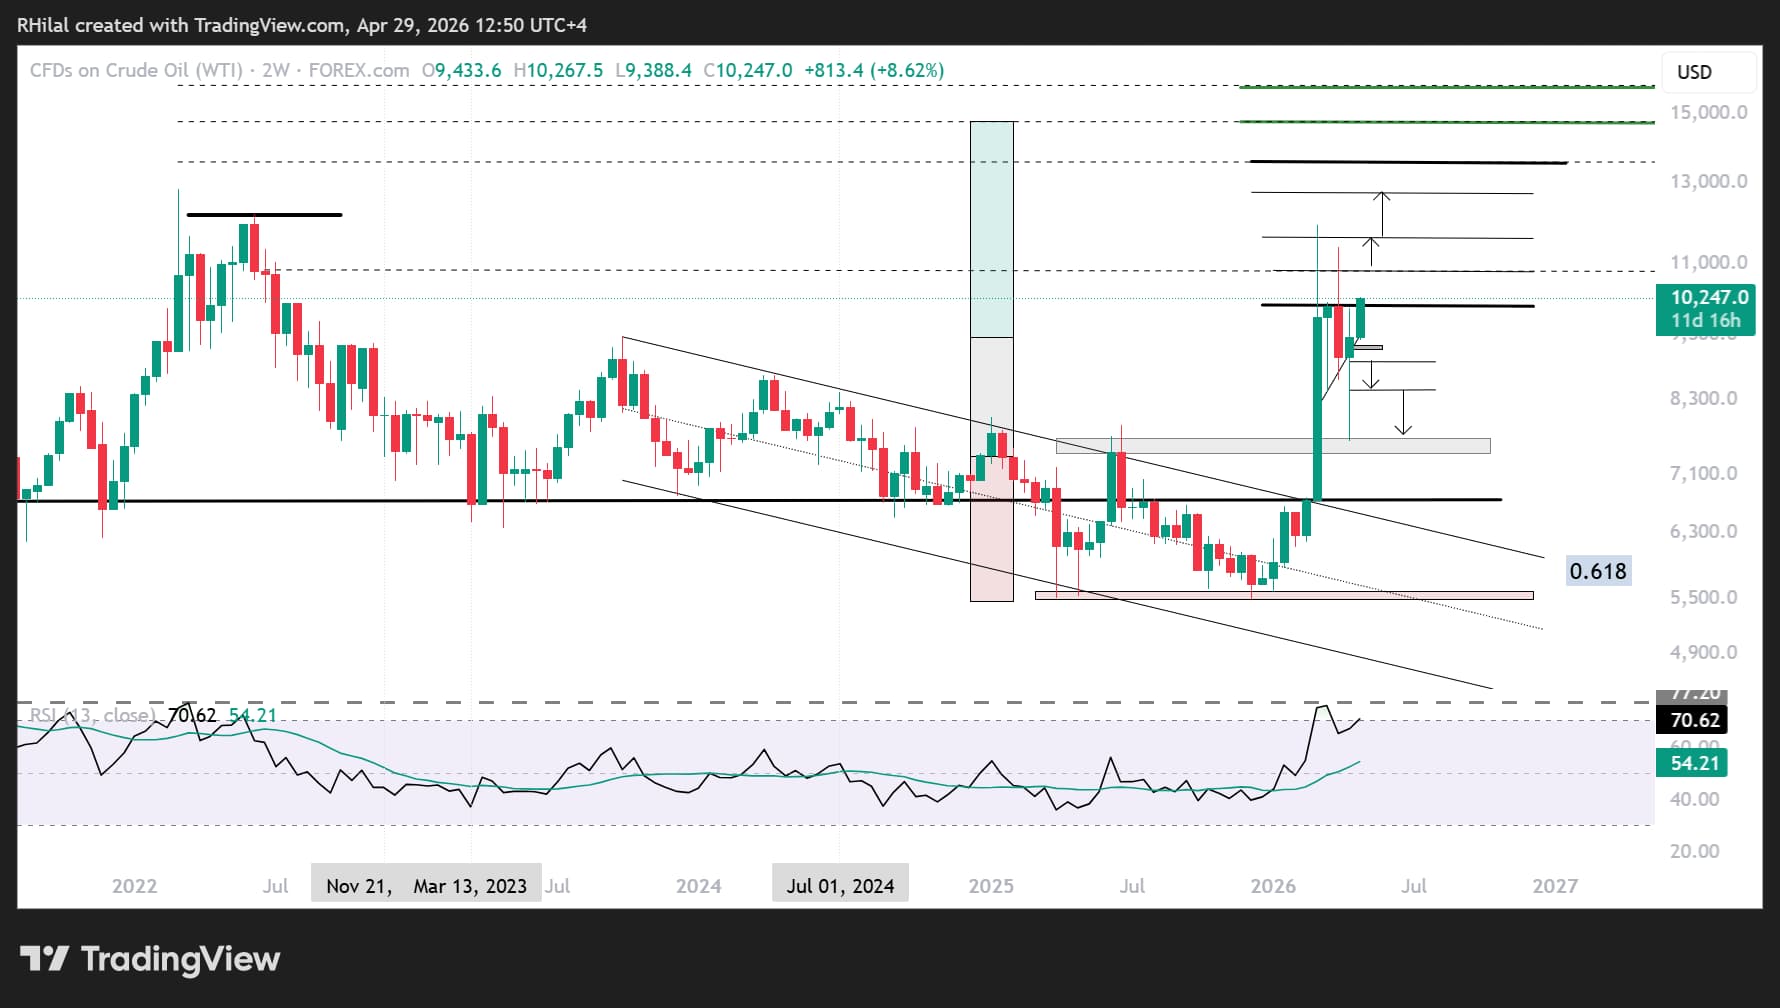
Crude Oil Price Outlook: 2 Week Time Frame – Log Scale
Source: Trading view
The three key scenarios highlighted in the Q2 2026 Outlook for crude are still standing, reinforcing price action and investor positioning as a more reliable lead than headline swings, cutting through the noise of the Middle east conflict scenario outcomes with three zones
Upper range (strength continuation):
Price remains above the 2023 highs, $88-$93 range, with a strong rejection to the $76 zone, and weekly closes holding above the $88 zone. A move above $110 and $115 could open the path toward $135, $145, and the $157–160 range, levels derived via the Fibonacci extension tool placed between the 2020-2022-and 2025 extremes.
Middle range (stabilization zone):
A move towards $84-$82 may see another short rebound. However, a confirmed break could expose downside toward $76- $74, aligning with previous Middle East conflict highs, also involving US-Israel-Iran.
Lower range (extended weakness):
A weekly close below $74 could expose a move toward the $67 zone and then back to the lower end of the 60s range, signaling a return to broader bearish consolidation forecasts aligned with the Trump administration’s initial policy agenda.
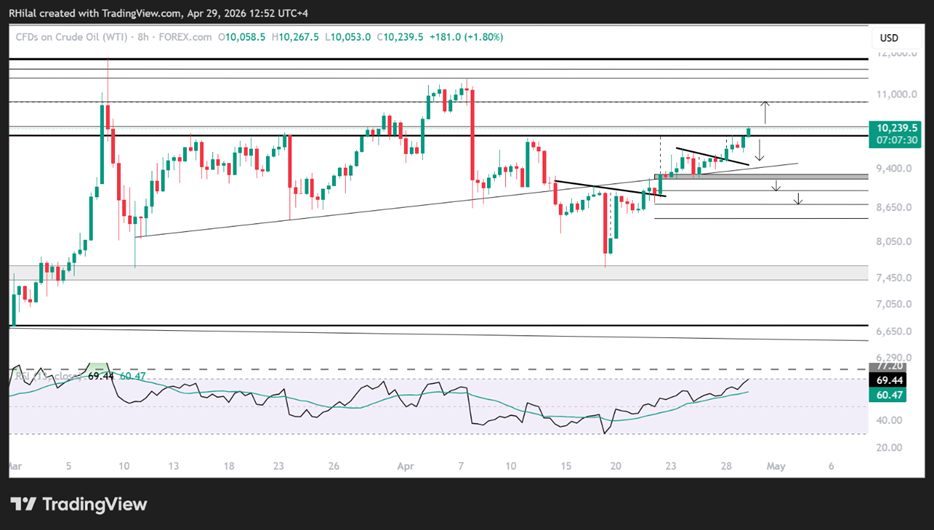
Crude Oil Price Outlook: 8-Hour Time Frame – Log Scale
Source: Trading view
From a shorter-term perspective, reversal patterns have formed and played out on the chart, most notably inverted head and shoulders structures. One marked a reversal from the $76 support level—coinciding with a prior conflict high—while another supported the continuation toward the $100 mark, where price has since seen a pullback in line with the UAE announcement and pattern targets.
A move higher would strengthen the bullish case, with a close above $103 opening the path toward $109 and $115, before potentially extending toward new highs.
On the downside, a break below the trendline connecting higher lows since March 2026, near the $91 level, would reinforce short-term downside risks toward $76–$74.
Key Takeaway
With volatility risks rising, long-term technical levels remain essential in filtering out short-term noise and confirming structural shifts in the market.
Written by Razan Hilal, CMT
Follow on X: @Rh_waves



Open an account in minutes
Experience award-winning platforms with fast and secure execution, and enjoy tight spreads from 0.5 pts on FX and 0.3 pts on indices.
Economic calendar
Web Trader platform
Our sophisticated web-based platform is packed with features.
Related articles

USD/JPY weekly outlook: Quarter turn scrambles rates regime
USD/JPY’s tight relationship with front-end US rates broke down sharply last week, but quarter-turn flows and positioning suggest the disconnect may prove temporary.


Dow Jones Forecast: DJIA rises after weaker jobs data
U.S. stocks are rising after weaker-than-expected U.S. jobs data saw markets rein in rate hike expectations.


What Stretched 10-Year Yields Mean for Major Currency Pairs in Q4
U.S. 10-year Treasury yields are nearing a long-term resistance zone with overbought RSI readings, raising near-term pullback risk for the dollar.
This report is intended for general circulation only. It should not be construed as a recommendation, or an offer (or solicitation of an offer) to buy or sell any financial products. The information provided does not take into account your specific investment objectives, financial situation or particular needs. Before you act on any recommendation that may be contained in this report, independent advice ought to be sought from a financial adviser regarding the suitability of the investment product, taking into account your specific investment objectives, financial situation or particular needs.
StoneX Financial Pte. Ltd., may distribute reports produced by its respective foreign entities or affiliates within the StoneX group of companies or third parties pursuant to an arrangement under Regulation 32C of the Financial Advisers Regulations. Where the report is distributed to a person in Singapore who is not an accredited investor, expert investor or an institutional investor (as defined in the Securities Futures Act), StoneX Financial Pte. Ltd. accepts legal responsibility to such persons for the contents of the report only to the extent required by law. Singapore recipients should contact StoneX Financial Pte. Ltd. at 6826 9988 for matters arising from, or in connection with the report.
In the case of all other recipients of this report, to the extent permitted by applicable laws and regulations neither StoneX Financial Pte. Ltd. nor its associated companies will be responsible or liable for any loss or damage incurred arising out of, or in connection with, any use of the information contained in this report and all such liability is hereby expressly disclaimed. No representation or warranty is made, express or implied, that the content of this report is complete or accurate.
StoneX Financial Pte. Ltd. is not under any obligation to update this report.
Trading CFDs carries a high level of risk that may not be suitable for some investors. Consider your investment objectives, level of experience, financial resources, risk appetite and other relevant circumstances carefully. The possibility exists that you could lose some or all of your investments, including your initial deposits. If in doubt, please seek independent expert advice. Visit www.forex.com/en-sg/terms-and-policies for the complete Risk Disclosure Statement.