


Crude oil: WTI correction a healthy development for longevity of the bullish trend
The pullback in crude oil could be deemed a healthy development, correcting an unsustainable, one-sided trade which left the contract overbought and over-loved.
Share this:

* WTI crude down 7% in three sessions
* Fundamentals remain bullish while near-term technical picture is bearish
* Price action around these levels could determine the scale of the current correction
Healthy bull markets need to breathe
One of the first lessons I was taught was that for bull markets to be sustainable, they needed to breathe occasionally, allowing fresh longs to join in whenever prices deviated a little too far from reality. In that context, the pullback in crude oil recently could be deemed a healthy development, correcting an unsustainable, one-sided trade which left the contract overbought and over-loved.
Bullish fundamental backdrop for crude remains in place
As is often the case, there have been no shortage of narratives to fit the price action, ranging from demand destruction from higher bond yields, potential supply disruptions in the Middle East being potentially resolved, along with fresh bearish forecasts from one analyst on the street. Perhaps they drove the reversal, but the fact the catalyst can’t be pinpointed suggests the rally simply ran out of bulls willing to buy.
But now we have better levels, will that remain that way given tightness in physical markets? Demand has held up even with higher prices while Saudi Arabia and Russia have already committed to curb oil production and exports until the end of the calendar year, seemingly suggesting the bullish fundamental picture remains much the same.
WTI price action today may determine scale of correction
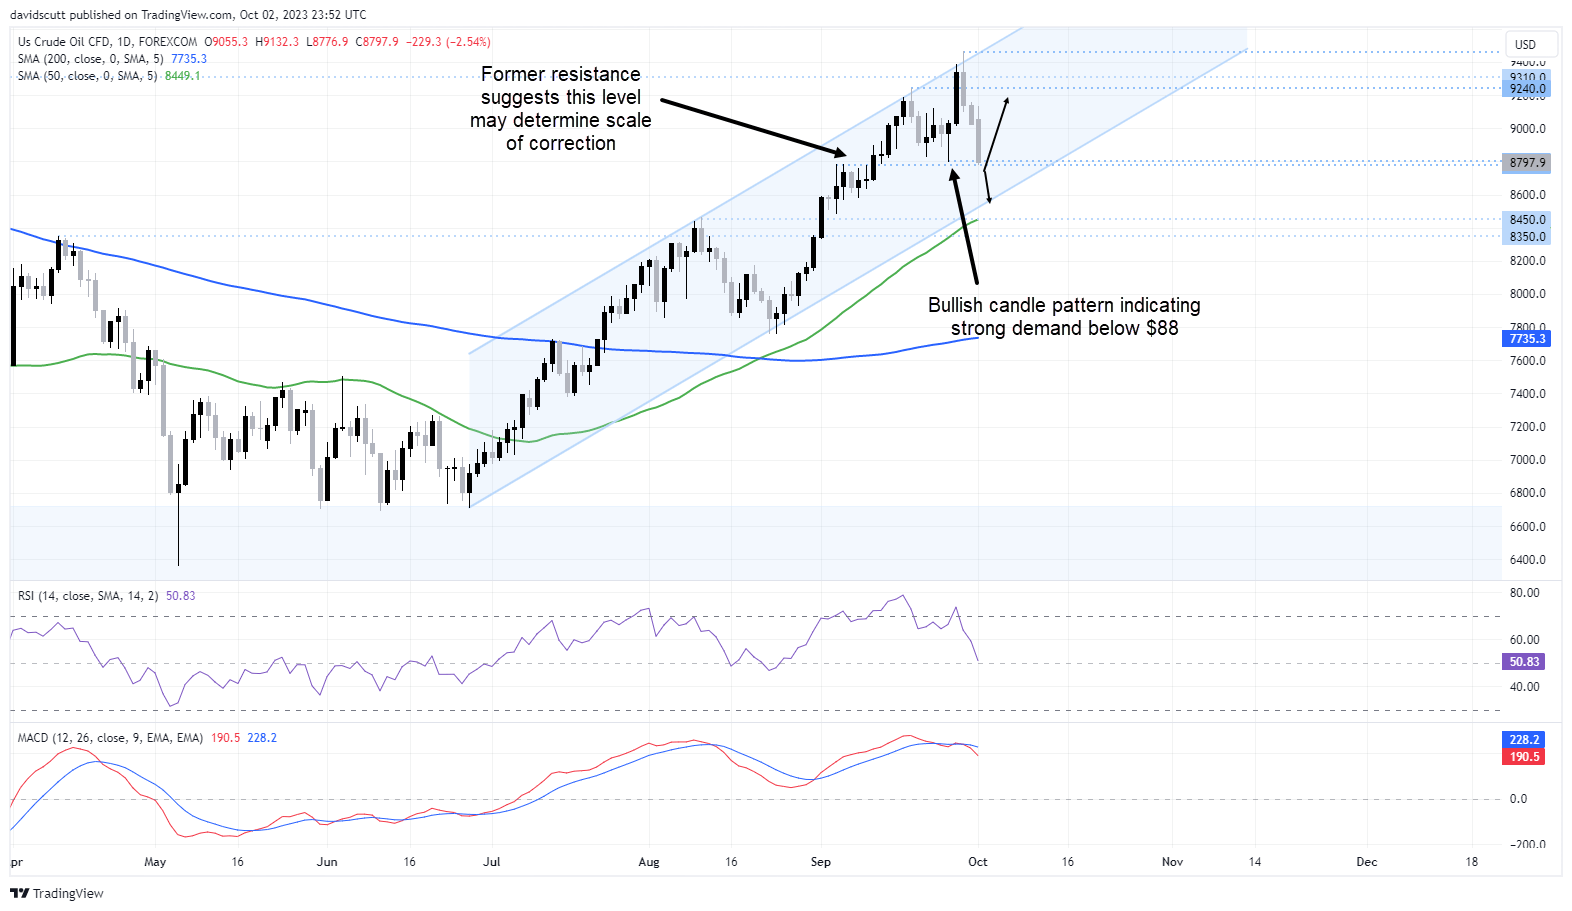
Looking at WTI on the daily, prices have now fallen over 7% from the highs hit on Thursday, underlining the speed of the current reversal. With the fundamental picture remaining bullish but the technical picture bearish near-term, the price action around this level may be informative as to where crude is likely to head next.
A sharp dip below $88 in late September attracted solid buying, resulting in a bullish hammer pattern being generated on the charts. Sitting just below that level today, which also acted as resistance earlier on in the crude rally, you get the sense that today holds the key as to just how far this correction will play out.
Trade optionality for WTI around these levels
On the downside, there isn’t any significant visible support until we get back to channel support found just above $85. Given the proximity to a long-term support/resistance zone between $83.50 to $84.50, that would likely be the limit to downside in the absence of a sharp turn in the fundamental backdrop. On the upside, minor resistance may be found around $91. Beyond that, $92.40 and the YTD high around $94.60 are the levels to watch.
Depending on which way price evolve today, a stop-loss either below or above $87.80 to $88 will offer protection against the trade working against you.
-- Written by David Scutt
Follow David on Twitter @scutty
How to trade with City Index
You can trade with City Index by following these four easy steps:
- Open an account, or log in if you’re already a customer
• Open an account in the UK
• Open an account in Australia
• Open an account in Singapore
- Search for the market you want to trade in our award-winning platform
- Choose your position and size, and your stop and limit levels
- Place the trade
Related tags:




Open an account in minutes
Experience award-winning platforms with fast and secure execution, and enjoy tight spreads from 0.5 pts on FX and 0.3 pts on indices.
Economic calendar
Web Trader platform
Our sophisticated web-based platform is packed with features.
Related articles

Dow Jones Forecast: DJIA rises after weaker jobs data
U.S. stocks are rising after weaker-than-expected U.S. jobs data saw markets rein in rate hike expectations.


Gold Price Forecast: XAU/USD Plunges 12.4% Toward Critical Support 10 1 2026
Softer inflation has revived expectations for a Fed pause, but Friday’s payrolls could put gold’s recovery prospects to the test.


Nasdaq 100 Forecast: NDX slips as Treasury yields keep rising
U.S. stocks are falling at the start of Q4, as gains in software stocks offset concerns over soaring Treasury yields. U.S. Treasury yields continue to rise, with the 10-year yield up 2 basis points at 5.31% and the 30-year at 5.66%, multi-decade highs.
This report is intended for general circulation only. It should not be construed as a recommendation, or an offer (or solicitation of an offer) to buy or sell any financial products. The information provided does not take into account your specific investment objectives, financial situation or particular needs. Before you act on any recommendation that may be contained in this report, independent advice ought to be sought from a financial adviser regarding the suitability of the investment product, taking into account your specific investment objectives, financial situation or particular needs.
StoneX Financial Pte. Ltd., may distribute reports produced by its respective foreign entities or affiliates within the StoneX group of companies or third parties pursuant to an arrangement under Regulation 32C of the Financial Advisers Regulations. Where the report is distributed to a person in Singapore who is not an accredited investor, expert investor or an institutional investor (as defined in the Securities Futures Act), StoneX Financial Pte. Ltd. accepts legal responsibility to such persons for the contents of the report only to the extent required by law. Singapore recipients should contact StoneX Financial Pte. Ltd. at 6826 9988 for matters arising from, or in connection with the report.
In the case of all other recipients of this report, to the extent permitted by applicable laws and regulations neither StoneX Financial Pte. Ltd. nor its associated companies will be responsible or liable for any loss or damage incurred arising out of, or in connection with, any use of the information contained in this report and all such liability is hereby expressly disclaimed. No representation or warranty is made, express or implied, that the content of this report is complete or accurate.
StoneX Financial Pte. Ltd. is not under any obligation to update this report.
Trading CFDs carries a high level of risk that may not be suitable for some investors. Consider your investment objectives, level of experience, financial resources, risk appetite and other relevant circumstances carefully. The possibility exists that you could lose some or all of your investments, including your initial deposits. If in doubt, please seek independent expert advice. Visit www.forex.com/en-sg/terms-and-policies for the complete Risk Disclosure Statement.