



DJIA, Nasdaq Price Outlook: Are the Rallies Reaching Their Limits?
DJIA, Nasdaq Price Outlook: are the rallies across US indices reaching their limits? Hormuz tensions have extended for a 9th week, weighing further on the inflation, central bank, and yield outlook.
Share this:

Are the rallies across US indices reaching their limits? Hormuz tensions have now entered their ninth week, adding pressure to inflation, central bank expectations, and the yield outlook.
Key events to watch:
- BOJ near-term intervention could support another bearish wave in USD/JPY below 154.80, while capping US indices gains amid carry trade unwind risks
- US employment, growth, and inflation data, with NFP scheduled for Friday
- Crude oil price risks: continuation above 115 or a pullback below 88 and 82
While these events help explain investor positioning, currently supported by positive earnings momentum, the extended rally warrants close attention to key resistance levels, particularly the four-year resistance on the Dow Jones chart, as Hormuz tensions extend to week 9.
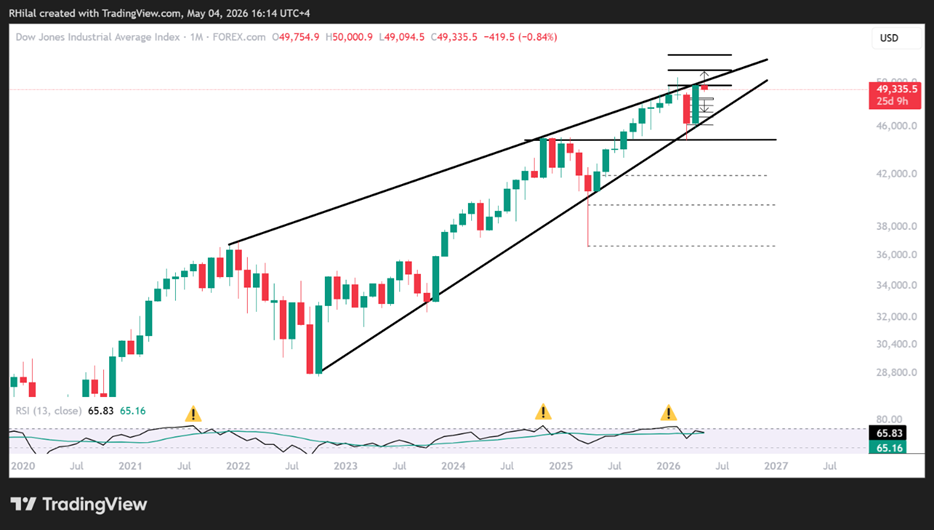
Dow Jones Price Outlook: Monthly Time Frame – Log Scale

Source: Trading view
The Dow Jones chart signaled early caution for pullback risks at the beginning of the year, as gains tested a four-year resistance connecting consecutive highs since 2022, following the bullish rebound from 2020 and forming a potential diagonal pattern.
The Middle East conflict triggered a drawdown from 50,500 toward the lower bound of this consolidation and 2025 highs near 44800 , followed by a rebound back to the upper boundary, where prices are once again testing resistance. The key question remains: are we facing another sharp pullback, or a long-term bullish breakout?
Key levels in focus:
- A close above 49,900 and 50,500 would invalidate the bearish setup and extend gains toward 51,200 and 52,700 initially
- A close below 48,500 would increase downside pressure toward 47,800, 47,300, and 46,800, opening the door for either a rebound or deeper correction
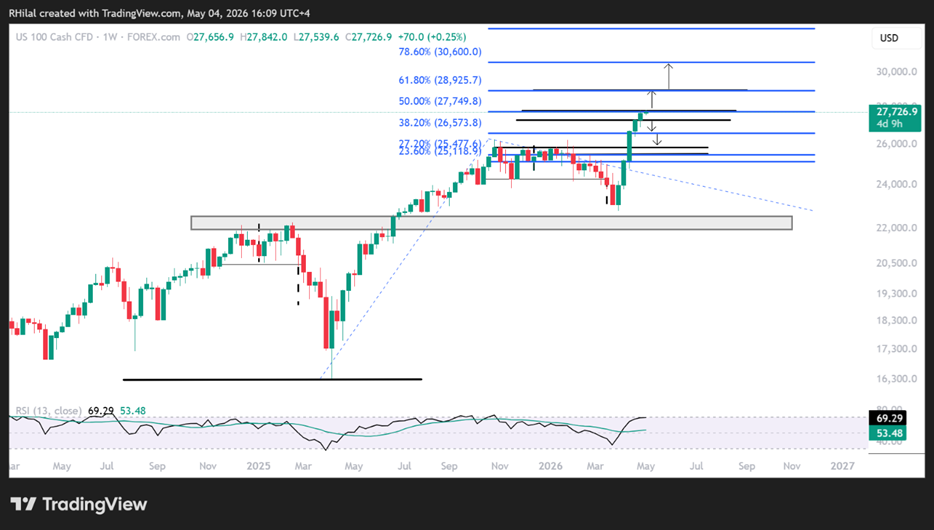
Nasdaq Price Outlook: Weekly Time Frame – Log Scale
Source: Trading view
From a weekly perspective, Nasdaq momentum is showing signs of slowing near overbought levels, similar to prior peaks seen in 2024 and 2025. This raises the risk of a pullback or momentum unwind as markets realize the Q2 pressure from Hormuz-related risks over Q1 earnings.
Key levels to watch, derived using Fibonacci extensions between the April 2025 lows, October 2025 highs, and April 2026 lows, are:
27,800 (0.5)
28,900 (0.618)
30,660 (0.786)
On the downside, a break below 26,900 would reinforce a pullback toward 26,300, 26,100, and 25800, levels representing potential rebound opportunities, aligning with the consolidation zone extending between October 2025 and February 2026.
Written by Razan Hilal, CMT
Follow on X: @Rh_waves
Related tags:



Open an account in minutes
Experience award-winning platforms with fast and secure execution, and enjoy tight spreads from 0.5 pts on FX and 0.3 pts on indices.
Economic calendar
Web Trader platform
Our sophisticated web-based platform is packed with features.
Related articles
USD/JPY weekly outlook: Quarter turn scrambles rates regime
USD/JPY’s tight relationship with front-end US rates broke down sharply last week, but quarter-turn flows and positioning suggest the disconnect may prove temporary.

Dow Jones Slide Shows What Rate Hike Bets Mean for Stocks
The Dow Jones support breakdown shows rising bond yields and rate hike bets hitting U.S. stocks while tech giants prop up the Nasdaq.


Dow Jones Forecast: DJIA rises after weaker jobs data
U.S. stocks are rising after weaker-than-expected U.S. jobs data saw markets rein in rate hike expectations.

This report is intended for general circulation only. It should not be construed as a recommendation, or an offer (or solicitation of an offer) to buy or sell any financial products. The information provided does not take into account your specific investment objectives, financial situation or particular needs. Before you act on any recommendation that may be contained in this report, independent advice ought to be sought from a financial adviser regarding the suitability of the investment product, taking into account your specific investment objectives, financial situation or particular needs.
StoneX Financial Pte. Ltd., may distribute reports produced by its respective foreign entities or affiliates within the StoneX group of companies or third parties pursuant to an arrangement under Regulation 32C of the Financial Advisers Regulations. Where the report is distributed to a person in Singapore who is not an accredited investor, expert investor or an institutional investor (as defined in the Securities Futures Act), StoneX Financial Pte. Ltd. accepts legal responsibility to such persons for the contents of the report only to the extent required by law. Singapore recipients should contact StoneX Financial Pte. Ltd. at 6826 9988 for matters arising from, or in connection with the report.
In the case of all other recipients of this report, to the extent permitted by applicable laws and regulations neither StoneX Financial Pte. Ltd. nor its associated companies will be responsible or liable for any loss or damage incurred arising out of, or in connection with, any use of the information contained in this report and all such liability is hereby expressly disclaimed. No representation or warranty is made, express or implied, that the content of this report is complete or accurate.
StoneX Financial Pte. Ltd. is not under any obligation to update this report.
Trading CFDs carries a high level of risk that may not be suitable for some investors. Consider your investment objectives, level of experience, financial resources, risk appetite and other relevant circumstances carefully. The possibility exists that you could lose some or all of your investments, including your initial deposits. If in doubt, please seek independent expert advice. Visit www.forex.com/en-sg/terms-and-policies for the complete Risk Disclosure Statement.