







DJIA, S&P 500, Nasdaq 100 Forecast: US Indices Vulnerable Through Earnings Season
The DJIA, S&P 500, and Nasdaq 100 all look vulnerable to more downside as long as this week’s highs hold.
Share this:

DJIA, S&P 500, Nasdaq 100 Key Points
- META’s stock price is falling -13% on weak Q2 revenue forecasts, dragging down indices like the S&P 500 and Nasdaq 100.
- Earnings season continues with Alphabet/Google and Microsoft after the bell today, as well as Amazon and Apple next week.
- The DJIA, S&P 500, and Nasdaq 100 all look vulnerable to more downside as long as this week’s highs hold.
META / Facebook Earnings Drag Indices Lower
After the close yesterday, Meta Platforms (META), the parent of Facebook and Instagram, reported its first quarter earnings, highlighted by profits of $4.71 per share and total revenue of $36.46 billion, which is a 27% increase from last year. The company also more than doubled its net income to $12.37 billion.
Despite these strong results, META’s stock price is falling -13% as we go to press, ostensibly because the revenue forecast for the next quarter was lower than what analysts expected, between $36.5 billion and $39 billion, which didn't meet the hoped-for $38.3 billion.
The drop in stock price is also being driven by Meta's plan to spend more on areas that don't yet make money, such as mixed reality and AI technologies, which CEO Mark Zuckerberg discussed during the earnings call. Additionally, Meta increased its expected spending on tech infrastructure, especially for AI, to between $35 billion and $40 billion for the year.
As one of the “Magnificent Seven” technology stocks that have driven much of the market’s gains over the past year+, the disappointing Q2 guidance from META has index traders worried that heavy investments in AI infrastructure may hurt profits for other “Big Tech” stocks. Looking ahead, traders will be monitoring the results from Alphabet/Google and Microsoft after the bell today, as well as Amazon and Apple next week.
Dow Jones Technical Analysis – DJIA Daily Chart
Source: TradingView, StoneX
Despite not holding META directly at all, the Dow Jones Industrial Average (DJIA) is seeing the worst performance of the day among the major US indices. From a technical perspective, the index has confirmed clear resistance at 38,500, where previous support from February and March meet the declining 50-day EMA. As long as the index remains below that level, bears will remain in control, with potential for a pullback to the 38.2% Fibonacci retracement of the November-April rally at 37,060.
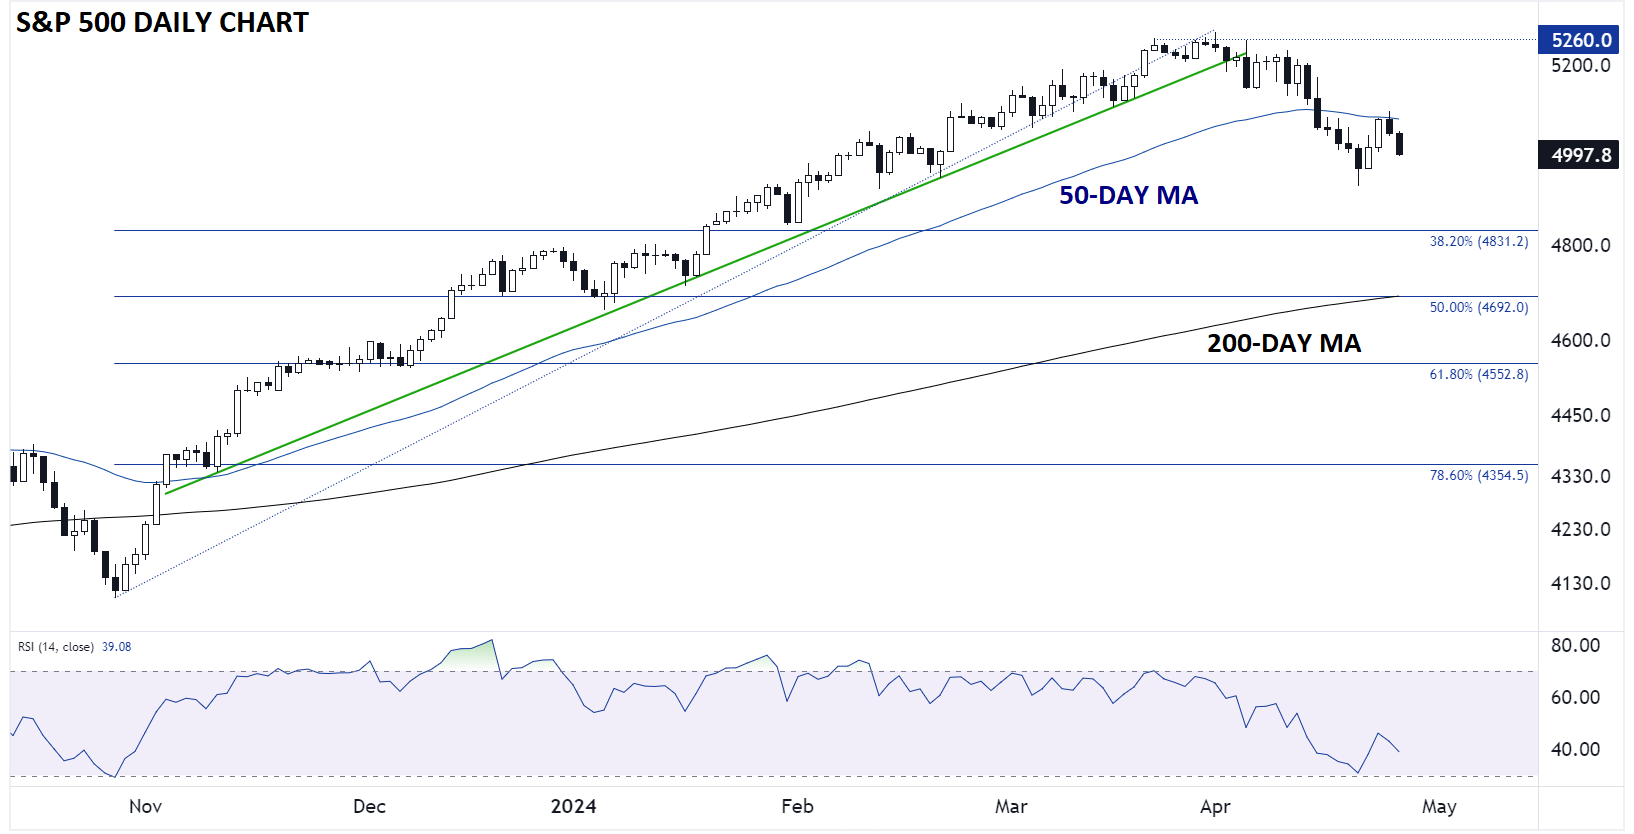
S&P 500 Technical Analysis – SPX Daily Chart
Source: TradingView, StoneX
The technical picture is similar for the S&P 500, with the index rising as high as 5,275 earlier this month before rolling over to test 5,000 as we go to press. Like the DJIA, the S&P 500 saw this week’s bounce stall at the 50-day EMA near 5,075, and with that level capping prices, a deeper retracement toward 4,830 may be in the cards next.
Nasdaq 100 Technical Analysis – NDX Daily Chart
Source: TradingView, StoneX
Last (and maybe least), the Nasdaq 100 saw a comparatively weak bounce to start this week, failing to reach even the bottom of its March consolidation range at 17,800 before yesterday’s reversal. Looking ahead, the lackluster bounces hints at relatively weak buying support on dips and opens the door for a retracement back toward the 23.6% Fibonacci retracement of the whole 2023-2024 rally near 16,650 next.
-- Written by Matt Weller, Global Head of Research
Follow Matt on Twitter: @MWellerFX
Related tags:



Open an account in minutes
Experience award-winning platforms with fast and secure execution, and enjoy tight spreads from 0.5 pts on FX and 0.3 pts on indices.
Economic calendar
Web Trader platform
Our sophisticated web-based platform is packed with features.
Related articles

Dow Jones Slide Shows What Rate Hike Bets Mean for Stocks
The Dow Jones support breakdown shows rising bond yields and rate hike bets hitting U.S. stocks while tech giants prop up the Nasdaq.


Dow Jones Forecast: DJIA rises after weaker jobs data
U.S. stocks are rising after weaker-than-expected U.S. jobs data saw markets rein in rate hike expectations.


Dow Jones forecast: Stock markets under pressure from multiple sources
When looking at the major tech-heavy US indices like the S&P 500 or the Nasdaq 100, you wouldn’t think that the stock market is particularly weak. Yet, beneath the surface, the market is far from healthy right now. Investors are evidently just piling into the big tech and AI names, and as a result, market breadth is deteriorating. Other indices like the small cap Russell 2000 and the Dow Jones are starting to reflect that weakness.
This report is intended for general circulation only. It should not be construed as a recommendation, or an offer (or solicitation of an offer) to buy or sell any financial products. The information provided does not take into account your specific investment objectives, financial situation or particular needs. Before you act on any recommendation that may be contained in this report, independent advice ought to be sought from a financial adviser regarding the suitability of the investment product, taking into account your specific investment objectives, financial situation or particular needs.
StoneX Financial Pte. Ltd., may distribute reports produced by its respective foreign entities or affiliates within the StoneX group of companies or third parties pursuant to an arrangement under Regulation 32C of the Financial Advisers Regulations. Where the report is distributed to a person in Singapore who is not an accredited investor, expert investor or an institutional investor (as defined in the Securities Futures Act), StoneX Financial Pte. Ltd. accepts legal responsibility to such persons for the contents of the report only to the extent required by law. Singapore recipients should contact StoneX Financial Pte. Ltd. at 6826 9988 for matters arising from, or in connection with the report.
In the case of all other recipients of this report, to the extent permitted by applicable laws and regulations neither StoneX Financial Pte. Ltd. nor its associated companies will be responsible or liable for any loss or damage incurred arising out of, or in connection with, any use of the information contained in this report and all such liability is hereby expressly disclaimed. No representation or warranty is made, express or implied, that the content of this report is complete or accurate.
StoneX Financial Pte. Ltd. is not under any obligation to update this report.
Trading CFDs carries a high level of risk that may not be suitable for some investors. Consider your investment objectives, level of experience, financial resources, risk appetite and other relevant circumstances carefully. The possibility exists that you could lose some or all of your investments, including your initial deposits. If in doubt, please seek independent expert advice. Visit www.forex.com/en-sg/terms-and-policies for the complete Risk Disclosure Statement.