







EUR/USD Bulls Gain Ground, NZD/USD Bullish Bets Surge: COT report
NZD positioning jumps at fastest pace in 7 years, EUR longs extend, silver hits sentiment extreme while gold lags.
Share this:

Speculative positioning across futures markets showed notable shifts in the week ending 20 May 2025. Net-long exposure to the New Zealand dollar surged at its fastest pace in seven years, while traders extended their bullish bias toward the euro. In contrast, metals markets saw a divergence, with silver approaching a sentiment extreme as gold speculators remained cautious. Meanwhile, Wall Street futures posted modest net-long increases, but positioning remains well below 2024 peaks.
View related analysis:
- USD Net Shorts Hit Record as AUD Bears Rise, CAD and EUR Gain – COT Report
- AUD/USD Weekly Outlook: Aussie Slides as Oil Surges on Middle East Tensions
- Australian Dollar Outlook: Will AUD/USD Follow NZD/USD Lower?
- Crude Oil Outlook: Will WTI Extend Gains or Fade as Middle East Tensions Peak?
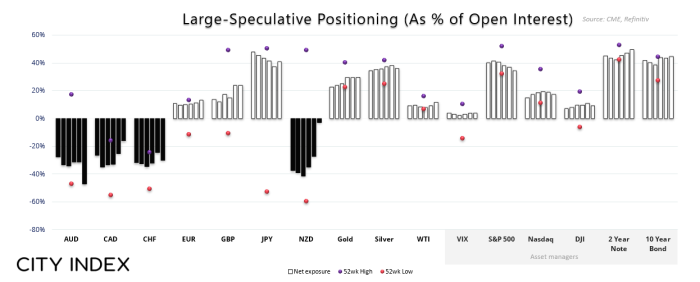
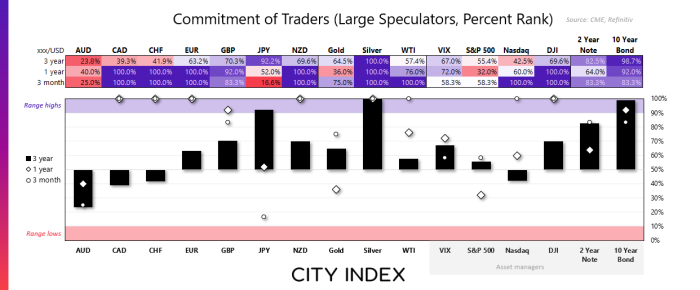
Weekly Market Positioning Overview – COT Report Highlights (17 June 2025)
• US Dollar (USD): Asset managers trimmed their record-high level of net-short exposure to the US dollar by a mere -75 contracts, while large speculators increased their by 3l contracts
• European dollar (EUR): Large speculators increased net-long exposure to the euro by 8.5k contracts to an 18-month high
• British pound (GBP): Traders reduced net-long exposure to GBP/USD futures by -8.7k contracts (shorts rose 6.7%, longs trimmed by -4.3%).
• Japanese yen (JPY): Net-long exposure fell -13.7k contracts, mostly driven by a 13% increase of gross-shorts (5.2k contracts)
• Australian dollar (AUD): Gross-longs reduced to AUD/USD futures by -11.7% (-2.8k), though net-short exposure was effectively flat
• Canadian dollar (CAD): Traders increased their gross-long exposure to CAD by 18.2% (7.4k contracts), and reduced shorts by -16.2% (-18.3k)
• Swiss franc (CHF): Traders reduced their overall exposure by reducing longs by -15% (-12k contracts) and also lowering shorts by -8.5% (-2.6k contracts)
• New Zealand dollar (NZD): Traders were on the cusp of flipping to net-long exposure by decreasing net-short exposure by 20k contracts
• Gold (GC): Large speculators increased net-long exposure by 6.4k contracts’
• Silver (SI): Bets against silver were on the rise with gross-shorts increasing by 17.7% (3.3k contracts)
• Crude Oil (WTI): Traders reduced short bets against crude oil by -16.2% (-22.5k contracts)
EUR/USD Positioning: Euro Futures – Weekly COT Report
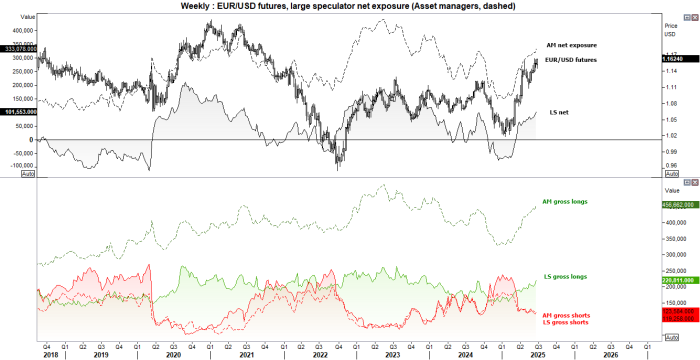
Asset managers increased their net-long exposure to EUR/USD future to a 16-month high, large speculators increased theirs to a 15-month high. And with the euro considering a break of its three-year, nine-month high at the time of writing, it is hard to be bullish on the US dollar index right now – despite stretched net-short exposure.
While large speculators saw a slight increase of gross-shorts, they also increased longs to their highest level since December 2023. And with net-long exposure not at a sentiment extreme for either trader, the EUR/USD could be looking at further gains to the detriment of the US dollar index.
NZD/USD Positioning: New Zealand Dollar Futures – Weekly COT Report
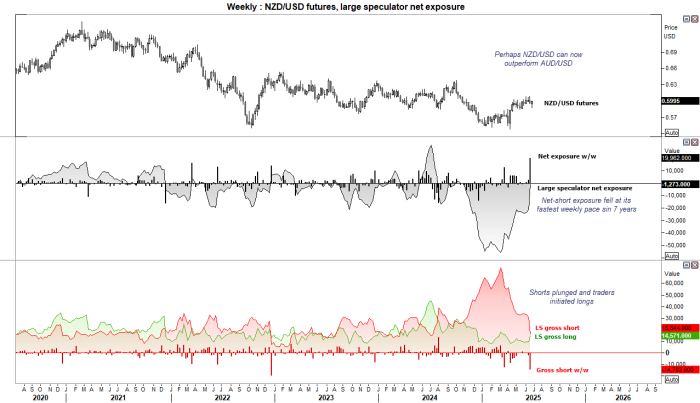
Net-long exposure to New Zealand dollar futures surged at their fastest weekly pace seven years. The 202k increase was fuelled by a reduction of -14.7k short contracts, its fastest pace since December 2022, and a 5.3k contract rise of longs. Asset managers also followed the same pattern of closing NZD/USD shorts in exchange for longs.
This coincided with positive developments from the US-China trade talks, after the Reserve Bank of New Zealand (RBNZ) had already dopped hints that the easing cycle was at or near an end. Perhaps NZD/USD will now be the outperformer over AUD/USD, given the potential for at least two more 25bp cuts from the Reserve Bank of Australian (RBA) this year.
Metals (Gold, Silver, Copper) Futures - COT report
While gold and silver prices have generally tracked each other higher in recent weeks, there is a clear divergence between the market positioning of the two. It is also plausible that silver positioning has reached a sentiment extreme, and gold’s gains could be capped with large speculators and managed funds less keen on chasing gold prices higher.
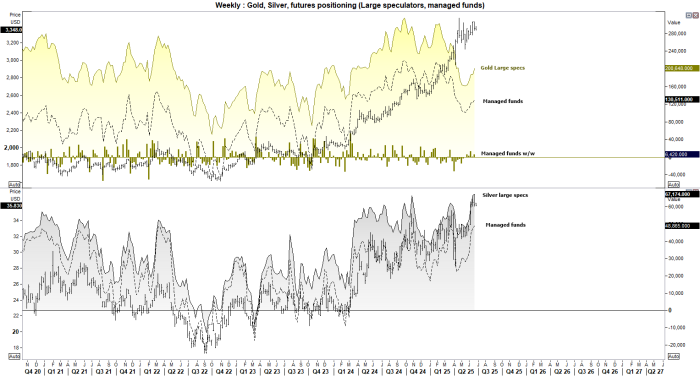
Gold Futures Positioning (GC): Weekly COT Report Analysis
• Large speculators and managed funds increased their net-long exposure to gold futures by a combined 21.5k contracts
• Net-long exposure is sitting around 10-week highs among both sets of traders
• Whole net-long exposure to gold has been trending higher in recent weeks, it remains low relative to prices to warn of caution among the larger players
Silver Futures Positioning (SI): Weekly COT Report Analysis
• Net-long exposure to silver futures rose to a 5-year high among large speculators and a 13-week high among managed funds
• Both sets of traders increased longs and shorts to show a lack of clarity around these highs
• A shooting star candle also formed last week to suggest neat-term exhaustion to Silver’s trend
Wall Street Indices Positioning (S&P 500, Nasdaq 100): Weekly COT Report
Net-long exposure has been retracing lower on Wall Street futures this year. Given we’re nearly six months down already, perhaps we’re nearing the point where net-long exposure beings to increase.

S&P 500 Futures Positioning (ES): Weekly COT Report Analysis
• Asset managers increased net-long exposure to S&P 500 futures by 20.6k contracts
• Gross-longs were trimmed by -3.5k contracts
• Gross-shorts fell by -238k
• Given S&P 500 futures are back above 6100, perhaps it will gun for its record high
Nasdaq 100 Futures Positioning (NQ): Weekly COT Report Analysis
• Net-long exposure to Nasdaq 100 futures rose to the 16-week high of 22.4k contracts
• Gross longs and shorts were increased by 2.7k contracts
• Gross-shorts increased by 910 contacts
• Like the S&P 500, the Nasdaq 100 could be considering a break for its all-time high
How to trade with City Index
You can easily trade with City Index by using these four easy steps:
- Open an account, or log in if you’re already a customer
• Open an account in the UK
• Open an account in Australia
• Open an account in Singapore
- Search for the company you want to trade in our award-winning platform
- Choose your position and size, and your stop and limit levels
- Place the trade
Related tags:



Open an account in minutes
Experience award-winning platforms with fast and secure execution, and enjoy tight spreads from 0.5 pts on FX and 0.3 pts on indices.
Economic calendar
Web Trader platform
Our sophisticated web-based platform is packed with features.
Related articles

USD/JPY Forecast: Is Rising Japanese Inflation Supporting the Yen?
As the trading week comes to an end, one of the most relevant developments in the FX market has been the renewed strength of the Japanese yen. This can be seen in the recent performance of USD/JPY, which has fallen nearly 1.0% over the last two trading sessions, highlighting a meaningful recovery in the Japanese currency against the U.S. dollar.


Australian Dollar Forecast: AUD/USD Support Reversal Sparks Monthly Range Breakout 10 23 2026
A sharp reversal off key support has fueled the AUD/USD recovery, with resistance now in focus ahead of next week’s Fed decision and Australian CPI.

USD/JPY, Nikkei Break Lower as AI Meltdown Spreads
Thursday’s tech tantrum has become Friday’s fire sale. With Nikkei support giving way and the yen strengthening, could the selling start feeding on itself?

This report is intended for general circulation only. It should not be construed as a recommendation, or an offer (or solicitation of an offer) to buy or sell any financial products. The information provided does not take into account your specific investment objectives, financial situation or particular needs. Before you act on any recommendation that may be contained in this report, independent advice ought to be sought from a financial adviser regarding the suitability of the investment product, taking into account your specific investment objectives, financial situation or particular needs.
StoneX Financial Pte. Ltd., may distribute reports produced by its respective foreign entities or affiliates within the StoneX group of companies or third parties pursuant to an arrangement under Regulation 32C of the Financial Advisers Regulations. Where the report is distributed to a person in Singapore who is not an accredited investor, expert investor or an institutional investor (as defined in the Securities Futures Act), StoneX Financial Pte. Ltd. accepts legal responsibility to such persons for the contents of the report only to the extent required by law. Singapore recipients should contact StoneX Financial Pte. Ltd. at 6826 9988 for matters arising from, or in connection with the report.
In the case of all other recipients of this report, to the extent permitted by applicable laws and regulations neither StoneX Financial Pte. Ltd. nor its associated companies will be responsible or liable for any loss or damage incurred arising out of, or in connection with, any use of the information contained in this report and all such liability is hereby expressly disclaimed. No representation or warranty is made, express or implied, that the content of this report is complete or accurate.
StoneX Financial Pte. Ltd. is not under any obligation to update this report.
Trading CFDs carries a high level of risk that may not be suitable for some investors. Consider your investment objectives, level of experience, financial resources, risk appetite and other relevant circumstances carefully. The possibility exists that you could lose some or all of your investments, including your initial deposits. If in doubt, please seek independent expert advice. Visit www.forex.com/en-sg/terms-and-policies for the complete Risk Disclosure Statement.