


Euro Forecast: EUR/USD, EUR/JPY, Takes Two to Tango
EUR/USD bears sparked a sequence after the Fed's rate cut but that fell flat last week. Meanwhile key support has shown in EUR/JPY and EUR/CAD just set a fresh 16-year high.
Share this:

The sell-off in EUR/USD stalled last week but bulls responded with a breakout from a short-term double bottom formation. EUR/JPY, on the other hand, retains clean bullish structure, with re-test of the 175.00 psychological level as support ahead of the end of the week. EUR/CAD similarly retains dovish lean, and I’ll look at all three Euro pairs below.
EUR/USD 1.1631 is Vital for USD Trends
The weekly chart of EUR/USD remains fairly messy and this is much to the chagrin of FX traders around the world. The major pair is a big piece of the puzzle as the Euro makes up 57.6% of the DXY quote, and as such, when the pair is range bound there can be a seeming lack of trend elsewhere. That’s largely been the case since July 1st, when EUR/USD punched up to a fresh three-year-high on the first day of Q3. A pullback ran cleanly through July but as soon as the US NFP report dropped on August 1st, its been a grinding range-bound affair.
More recently, hope for trend arrived in the form of a bearish break, following the reversal that initiated right when the Fed announced their rate cut in September. That brought in a lower-low last week, with the same exact price holding the low this week while producing a double bottom formation.
I spoke of that in the Tuesday webinar and then again in the Friday video (linked above), but that weekly chart still remains as indecisive and this puts pressure on price for next week. The 1.1748 level remains a key spot for EUR/USD bears as this held the high for five consecutive days before the breakdown into lower-lows. That level now serves as a form of invalidation for bears.
EUR/USD Weekly Chart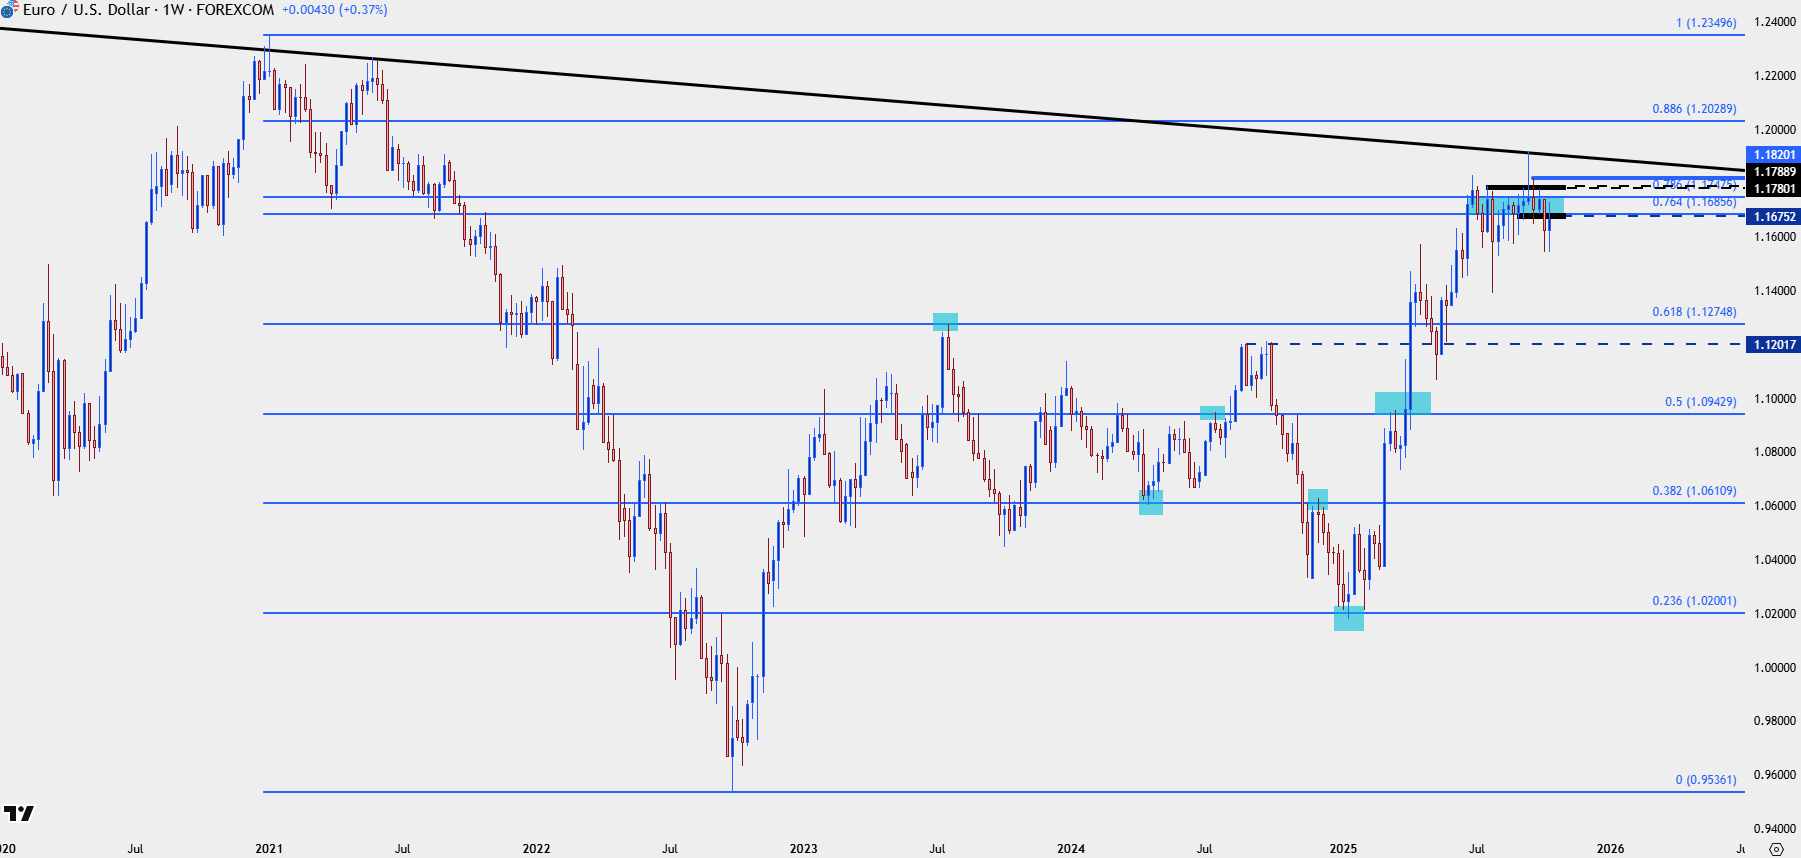
Chart prepared by James Stanley; data derived from Tradingview
From the above weekly chart, it’s the Fibonacci levels at 1.1686-1.1748 that stand out. This is the 76.4 and 78.6% retracements of the 2021-2022 major move, and they’re related to the 23.6% retracement that held support back in January. I looked into this Fibonacci setup in the evergreen article on the topic, and since then, this current zone of resistance has become like a brick wall for bulls that remains in-place today.
Perhaps more importantly, these Fibonacci levels helped to craft the lower-lows and highs that sets up the current sequence, and from the daily, there’s still the possibility of bearish continuation, provided that sellers can defend that structure.
From the daily, this retains the look of lower-lows and lower-highs, but a break above 1.1748 negates that. And, from shorter-terms, there can be another observation that highlights a significant level of possible support.
EUR/USD Daily Chart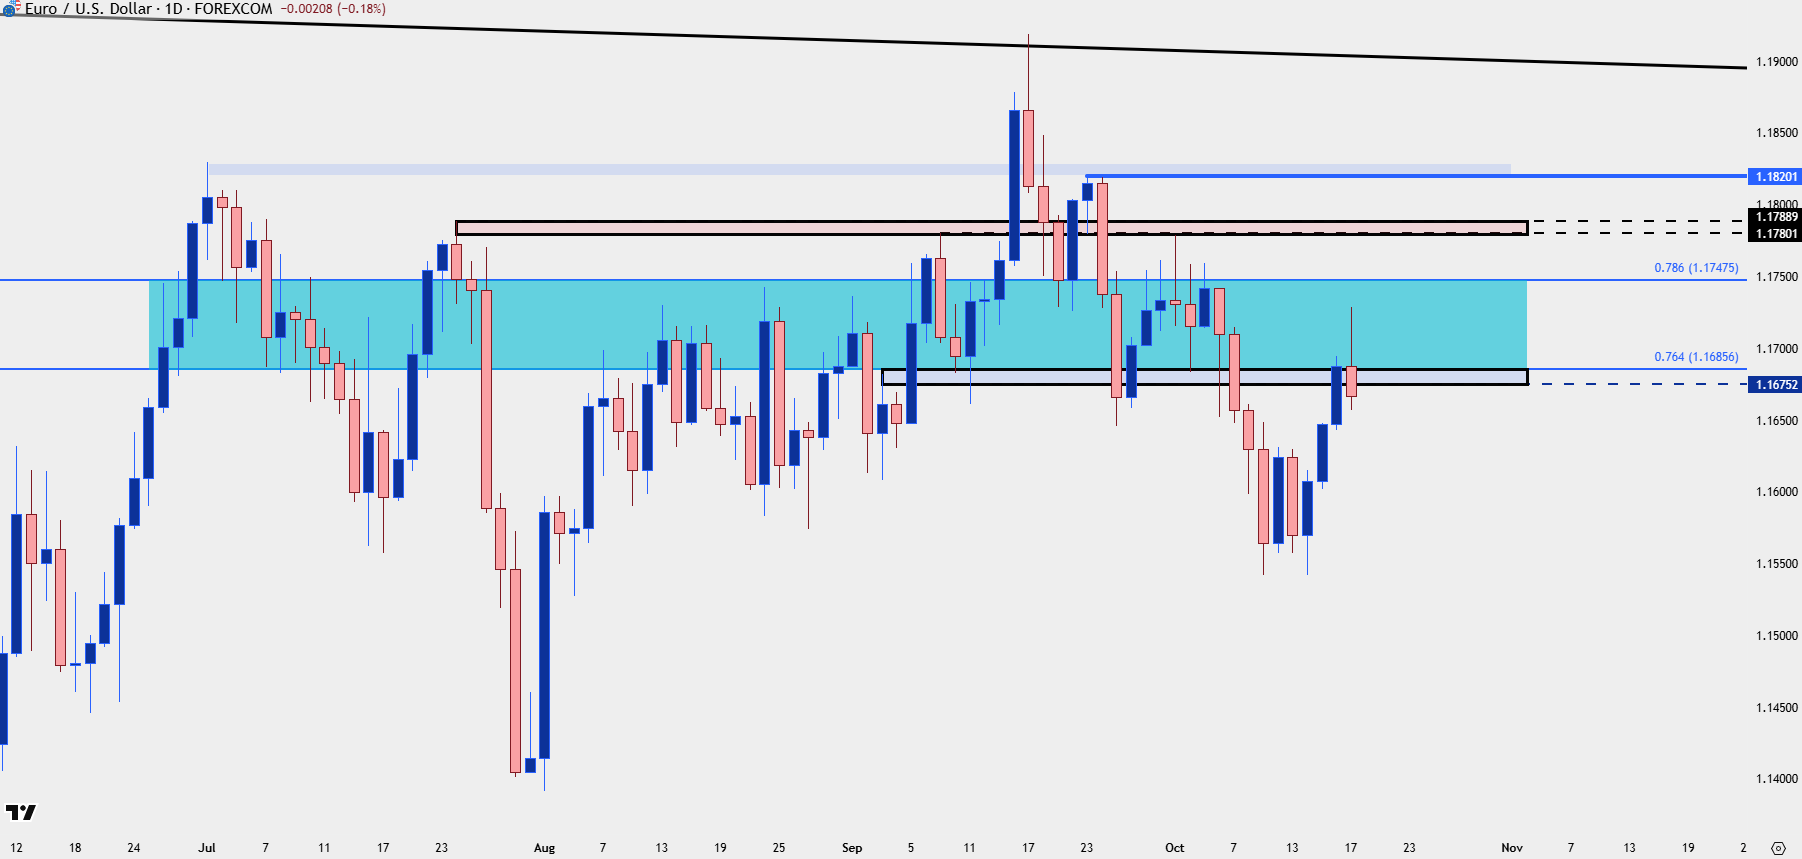
Chart prepared by James Stanley; data derived from Tradingview
In the Tuesday webinar I said that one of the main benefits of price action is its objectivity. It doesn’t care what I want and, instead, its up to me to read it without bias in effort of devising strategy. At the time, there was a perfect hold of the prior week low, and that set up a possible double bottom formation. These are often tracked with aim of bullish breakout, looking for a breach of the neckline, or the high between the two lows, to trigger into breakout setups. And then the distance between the bottoms and neckline is usually tracked for a projection of that move.
As I showed in the webinar this pointed towards 1.1720, which came into play early on Friday morning. So the formation filled in and ran to the projected target, and from the four-hour chart, this shows a higher-high and low sequencing on short-term charts.
It also highlights the neckline from the formation, at 1.1631, as a key spot for bulls to hold to retain that sequence. So, as said in the video for USD this week, if sellers can sink below that 1.1631 level, the bearish sequence on the daily chart will take on more attraction, as it illustrates sellers taking greater control. Or, conversely, if that holds, and bulls can run up and through 1.1748, the shorter-term setup will negate the bearish sequence, thereby opening the door for bulls to continue with the push.
This puts a lot of importance on that 1.1631 level for next week, but also as looked at in the video, there may be more amenable pastures for Euro-strength elsewhere, such as EUR/JPY. Or, as discussed in the article earlier on the day, EUR/CAD.
EUR/USD Four-Hour Chart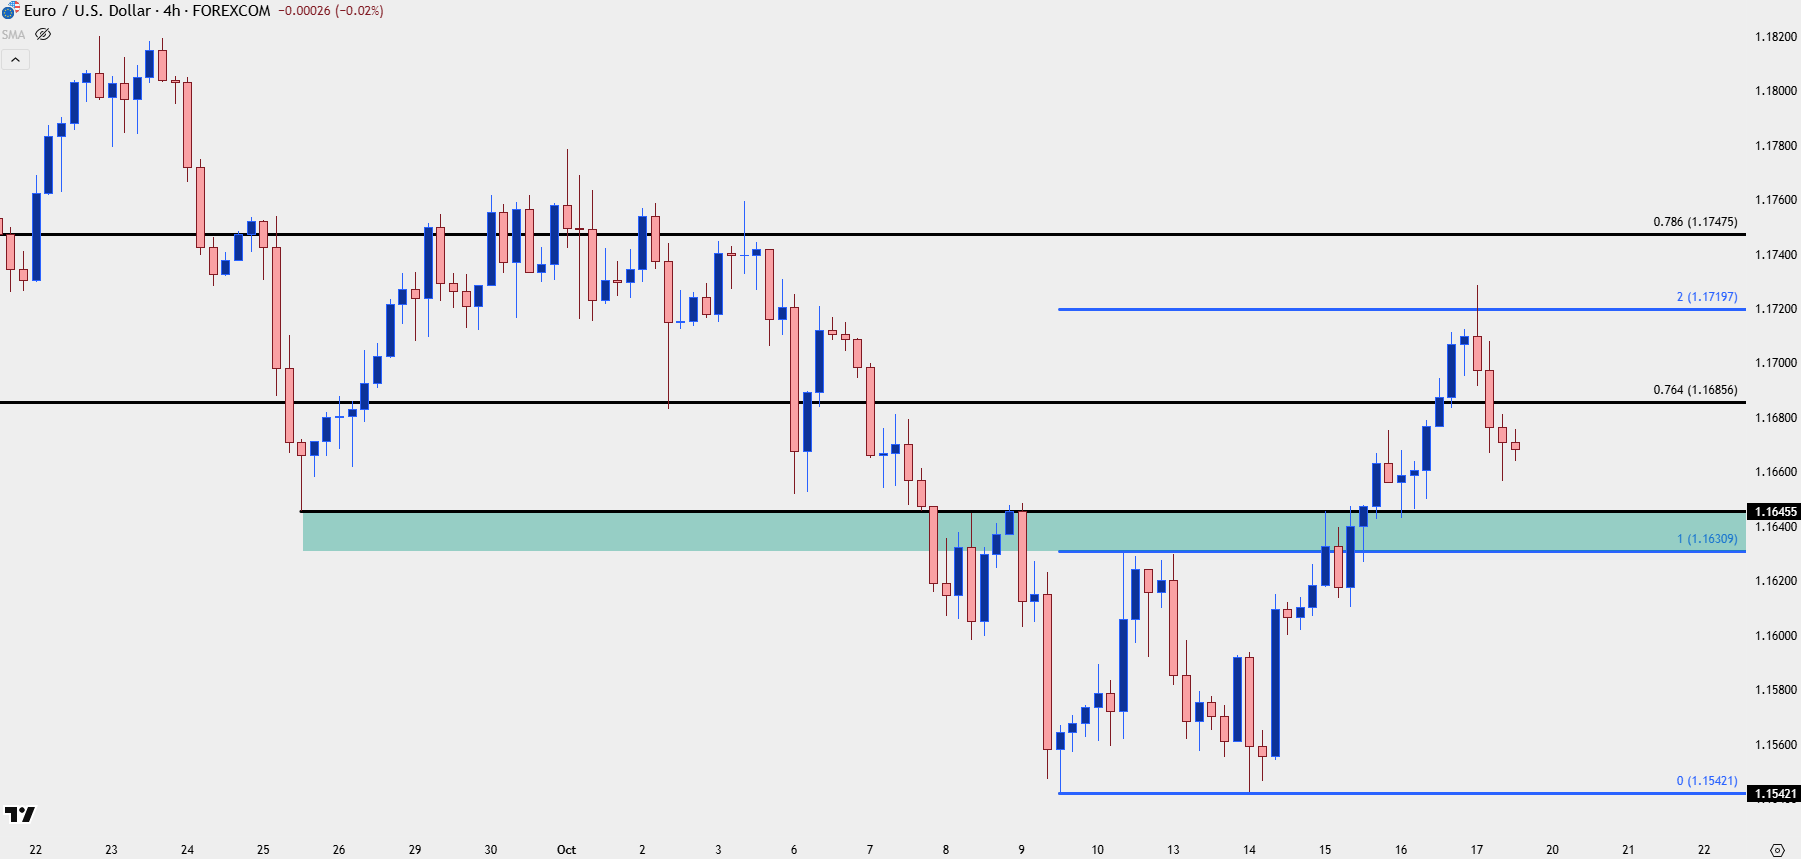
Chart prepared by James Stanley; data derived from Tradingview
EUR/JPY
USD/JPY set its current yearly low in April at the 140.00 handle, and USD/JPY is now testing the 145.00 handle after a decisive sell-off this week. But – that’s still 500 pips above the April swing low even as DXY remains somewhat near its own April low. This highlights the deduction of Yen-weakness and if looking for Euro-strength, that may be a better theme to work with than the tenuous backdrop in EUR/USD above.
In EUR/JPY, the pair has pulled back and so far held support at the 175.00 level, which set the highs in late-September. That resistance led to a pullback and show of support at the 61.8% retracement of the July sell-off, followed by a massive rally up to fresh highs. For three days of the past week, support held at the 2024 high of 175.43, but the Friday pullback tested below that and was followed by a strong response from bulls.
This retains bullish structure for the pair and it’s that 175.00 level that bulls need to hold to keep the door open for topside continuation.
EUR/JPY Daily Price Chart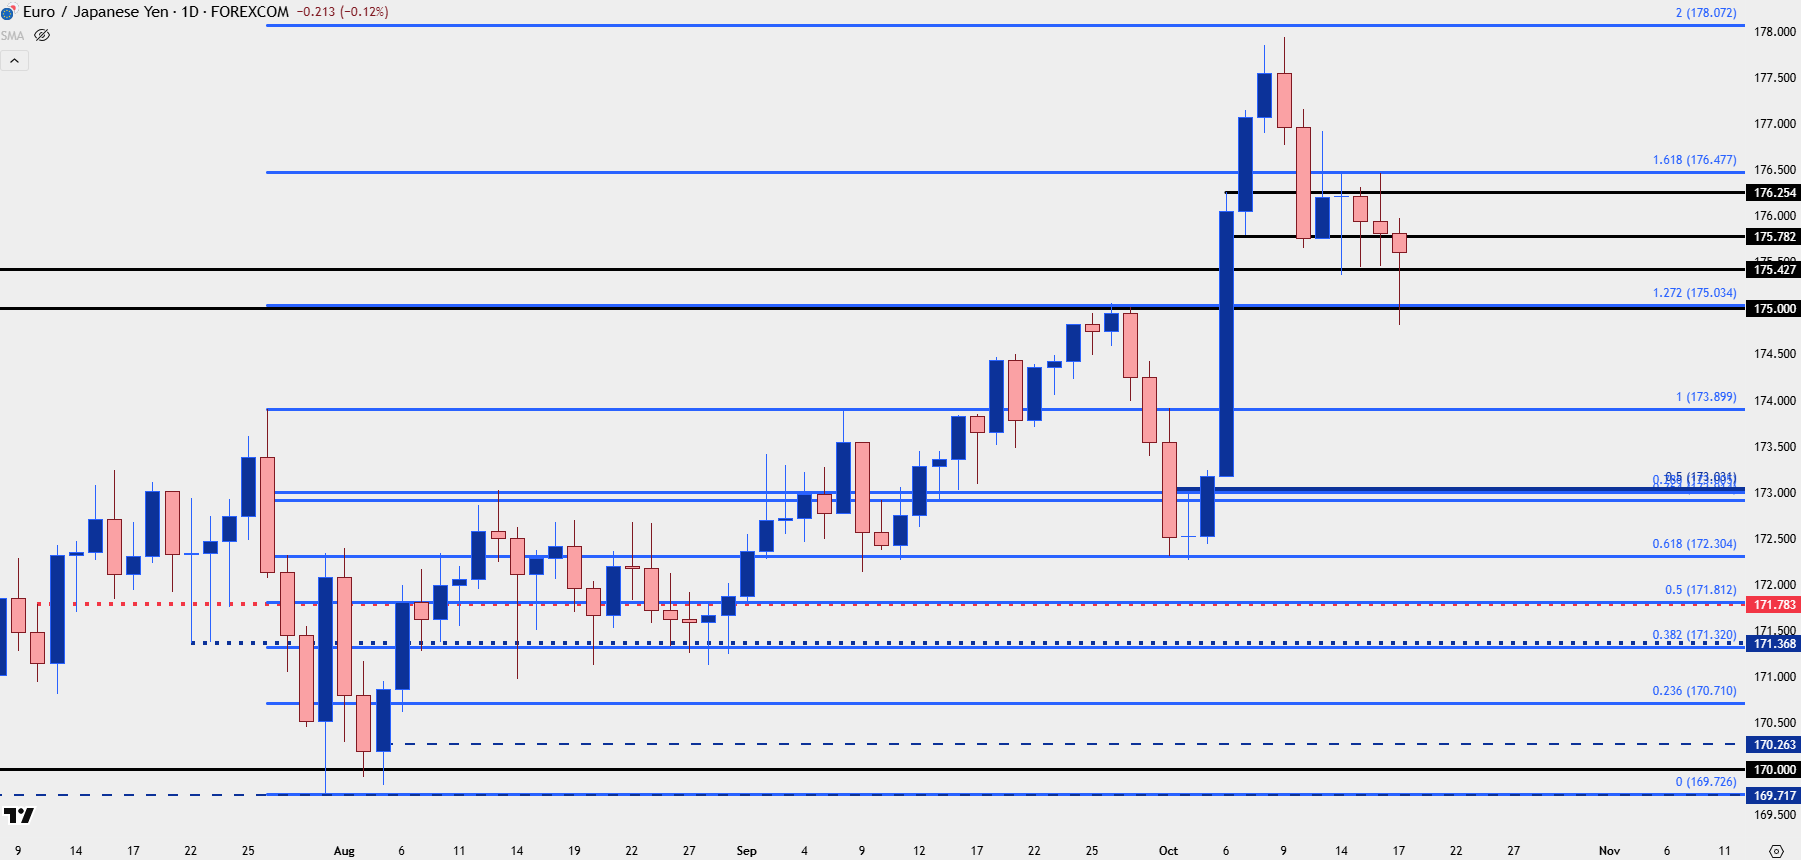
Chart prepared by James Stanley; data derived from Tradingview
EUR/CAD
On that same tune of meshing up weak currencies with potentially strong currencies, EUR/CAD can remain of interest. Similar to USD/JPY above, the major pair has deviated from DXY with USD/CAD setting a fresh six-month high this week even as the USD slumped and remained relatively near the fresh three-year lows established last month. But – while USD trends retain a question mark as bulls haven’t been able to drive a convincing rally above 100 in DXY yet, EUR/CAD can remain of interest.
At this point, EUR/CAD is already testing support at prior resistance, and there’s a Fibonacci level of note at 1.6231. Below that, 1.6106 is of interest as support potential taken from prior resistance.
EUR/CAD Daily Price Chart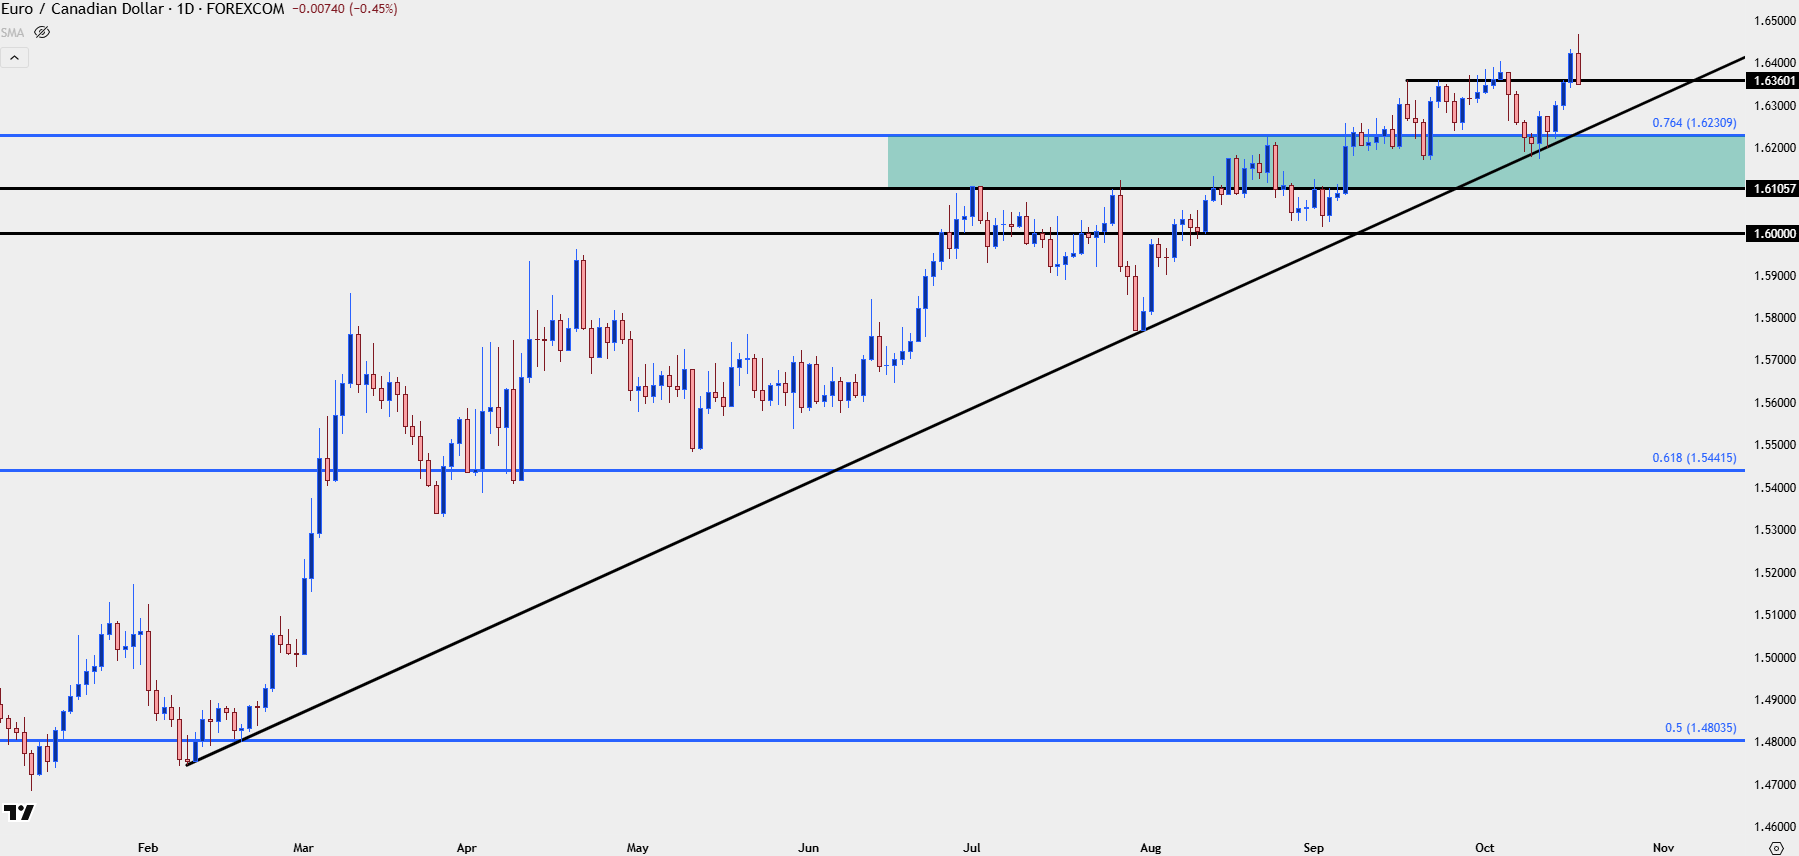
Chart prepared by James Stanley; data derived from Tradingview
--- written by James Stanley, Senior Strategist
Latest market news




Open an account in minutes
Experience award-winning platforms with fast and secure execution, and enjoy tight spreads from 0.5 pts on FX and 0.3 pts on indices.
Economic calendar
Web Trader platform
Our sophisticated web-based platform is packed with features.
Related articles
S&P 500, Nasdaq 100 Claw Back But NVDA Cloud Looms Overhead
Last week was green for both the Nasdaq and S&P 500 but given the sell-off that led into that bounce there’s still a very real question as to whether bears still have a statement to make. And the NVDA situation presents a very real threat.
US Dollar Price Action Setups: EUR/USD, USD/JPY
The US Dollar broke out to a fresh yearly high after the CPI report, and that Dollar strength was on full view in pretty much all major pairings with a particular push in EUR/USD.

Gold, EUR/USD hit 2026 lows as US yields erupt
US Treasury yields have staged one of their largest four-session increases in decades, hammering EUR/USD and gold. But while the euro's decline makes sense, gold's reaction has been extraordinary.

This report is intended for general circulation only. It should not be construed as a recommendation, or an offer (or solicitation of an offer) to buy or sell any financial products. The information provided does not take into account your specific investment objectives, financial situation or particular needs. Before you act on any recommendation that may be contained in this report, independent advice ought to be sought from a financial adviser regarding the suitability of the investment product, taking into account your specific investment objectives, financial situation or particular needs.
StoneX Financial Pte. Ltd., may distribute reports produced by its respective foreign entities or affiliates within the StoneX group of companies or third parties pursuant to an arrangement under Regulation 32C of the Financial Advisers Regulations. Where the report is distributed to a person in Singapore who is not an accredited investor, expert investor or an institutional investor (as defined in the Securities Futures Act), StoneX Financial Pte. Ltd. accepts legal responsibility to such persons for the contents of the report only to the extent required by law. Singapore recipients should contact StoneX Financial Pte. Ltd. at 6826 9988 for matters arising from, or in connection with the report.
In the case of all other recipients of this report, to the extent permitted by applicable laws and regulations neither StoneX Financial Pte. Ltd. nor its associated companies will be responsible or liable for any loss or damage incurred arising out of, or in connection with, any use of the information contained in this report and all such liability is hereby expressly disclaimed. No representation or warranty is made, express or implied, that the content of this report is complete or accurate.
StoneX Financial Pte. Ltd. is not under any obligation to update this report.
Trading CFDs carries a high level of risk that may not be suitable for some investors. Consider your investment objectives, level of experience, financial resources, risk appetite and other relevant circumstances carefully. The possibility exists that you could lose some or all of your investments, including your initial deposits. If in doubt, please seek independent expert advice. Visit www.forex.com/en-sg/terms-and-policies for the complete Risk Disclosure Statement.