


US Dollar Talking Points:
- The US Dollar has broken out of the falling wedge formation looked at in last week’s webinar, with the rally stalling at 99.40 which has since built a shorter-term symmetrical triangle, which can be construed as a bull pennant.
- EUR/USD has stalled ahead of a 1.1500 test and GBP/USD has formed a short-term falling wedge formation. USD/CAD has continued to jump to fresh six-month highs and remains one of the more attractive major FX pairs for USD-strength scenarios.
- This is an archived webinar and you’re welcome to join the next. Click here to register.
The US Dollar has broken out from the falling wedge formation looked at last week and that rally ran cleanly until a test of the 99.40 level in DXY, which has since come in as resistance for three of the past four trading days. Bulls aren’t out of it yet, as there’s been a hold of higher-lows that I’ll look at below, but there’s now possible bullish formations in both EUR/USD and GBP/USD which could further compel pullbacks in DXY.
At this point, it’s the 98.98 Fibonacci level that remains key for buyers as that currently marks a short-term pattern of higher-lows.
US Dollar Daily Price Chart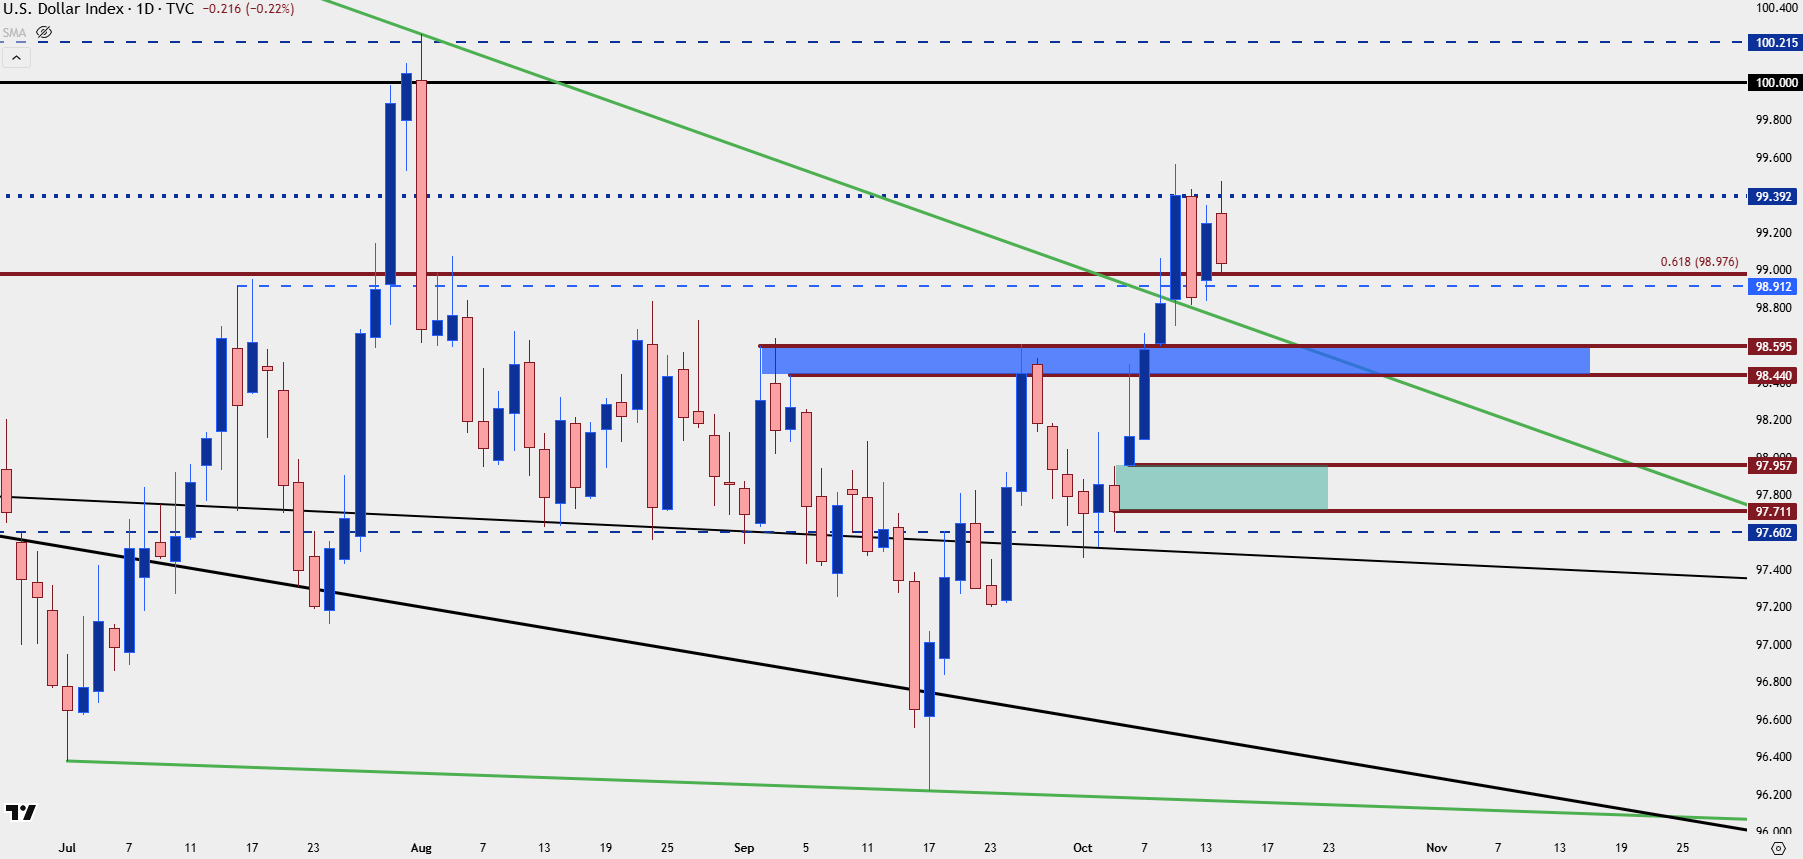
Chart prepared by James Stanley; data derived from Tradingview
US Dollar Bull Pennant
Shorter-term, there’s been both lower-highs and higher-lows since last week’s breakout and this makes for a symmetrical triangle formation. Normally these formations carry no directional bias as it’s largely digestion, but when added atop a bullish trend, they can be construed as a bull pennant, very similar to the formations in gold in the final two months of last year and then the four months this year from April until the August breakout.
In USD, the ideal area of support for bulls to hold would be the 98.98 level. But, even if that doesn’t happen, there’s scope for support at prior resistance around the 98.50 level, and then from the unfilled gap from last week’s open, shown in green below.
US Dollar Four-Hour Chart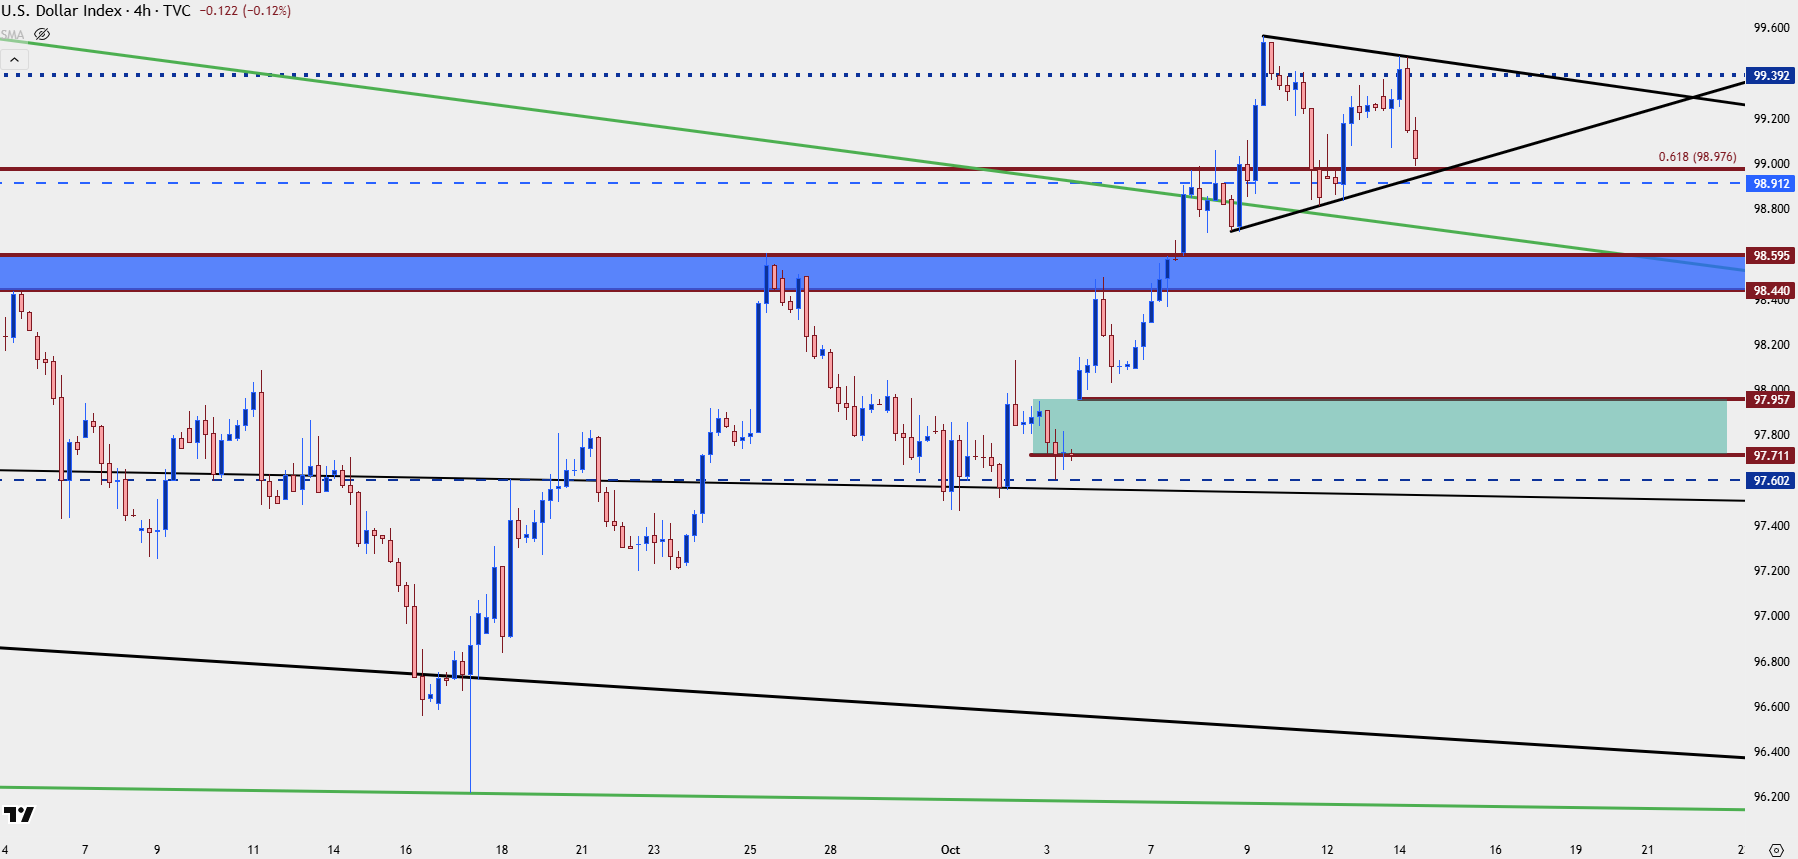
Chart prepared by James Stanley; data derived from Tradingview
EUR/USD Double Bottom
The level at 1.1543 has now held the low in EUR/USD on two separate occasions, and that sets up a possible double bottom formation with approximately 90 pips from bottom to neckline. If that neckline gets pierced, the door opens for bullish breakout, and the projected move from that formation would point towards 1.1720, which, interestingly, could keep the broader bearish trend intact given that the prior lower-highs was at the 1.1748 Fibonacci level. This would seem to coincide with a USD push down to that secondary support zone around 98.50.
EUR/USD Four-Hour Chart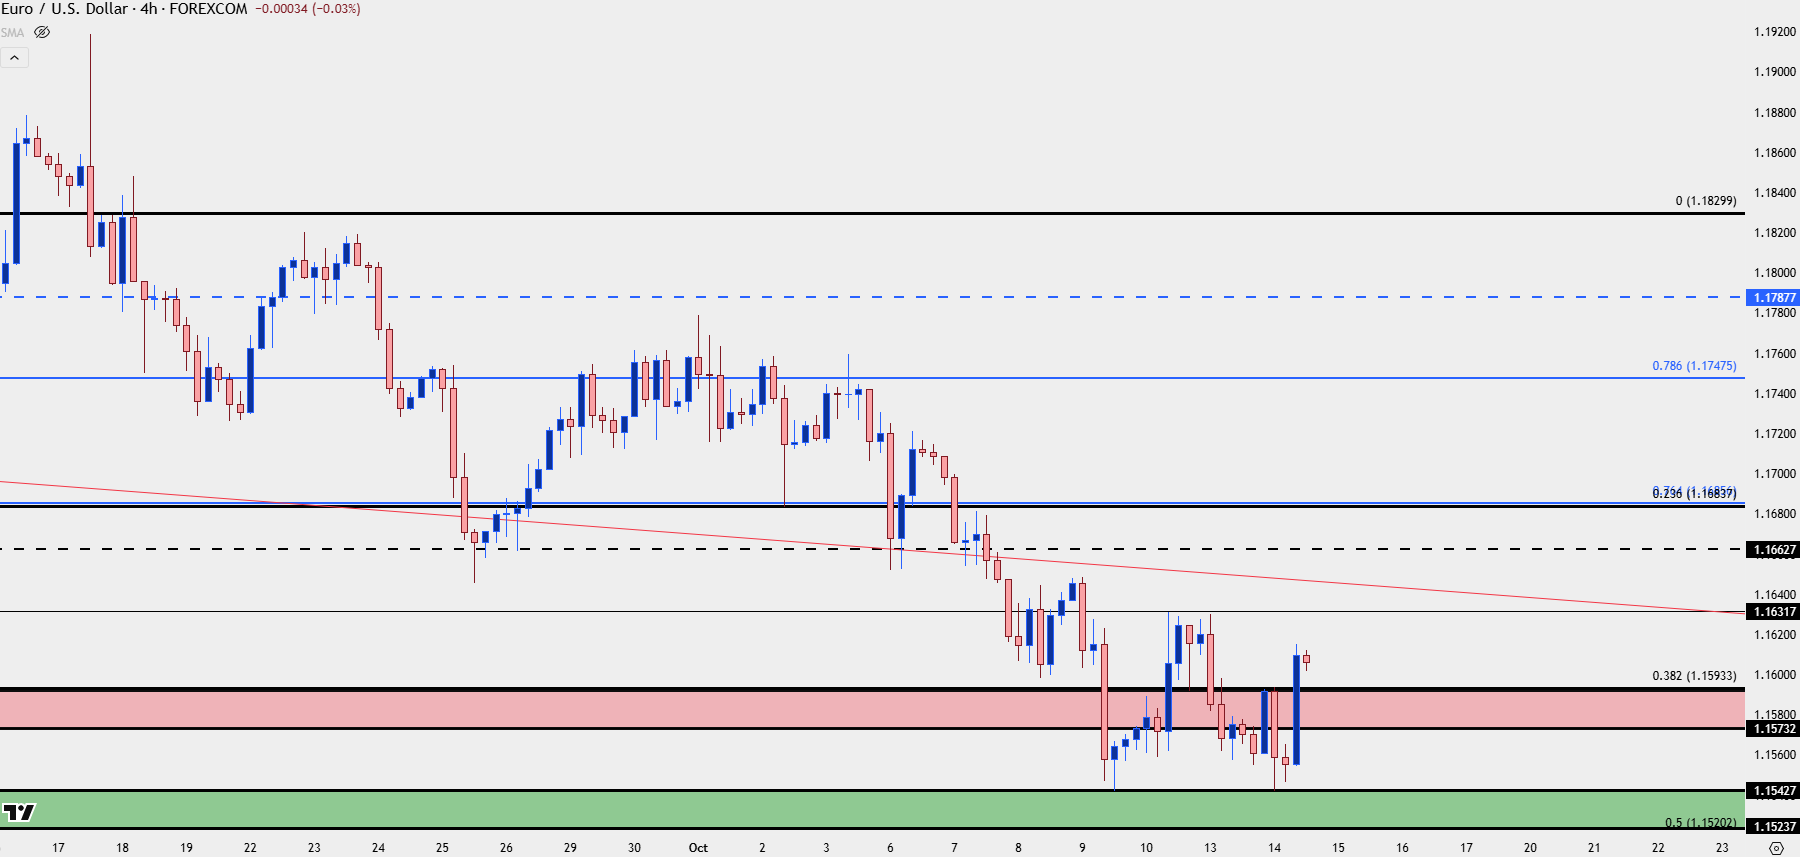
Chart prepared by James Stanley; data derived from Tradingview
GBP/USD Falling Wedge
As looked at last week with the USD falling wedge, these formations are often approached with aim of bullish reversal. GBP/USD has seen a passive push from sellers at lower-lows while bears have remained more aggressive at resistance or lower-highs, thereby leading to the build of the formation.
As I said in the webinar, this looks more attractive to me for prolonged pushes of USD-weakness when compared to the EUR/USD setup above.
For GBP/USD, we’re already re-testing a big Fibonacci level, with another overhead at 1.3414.
GBP/USD Four-Hour Chart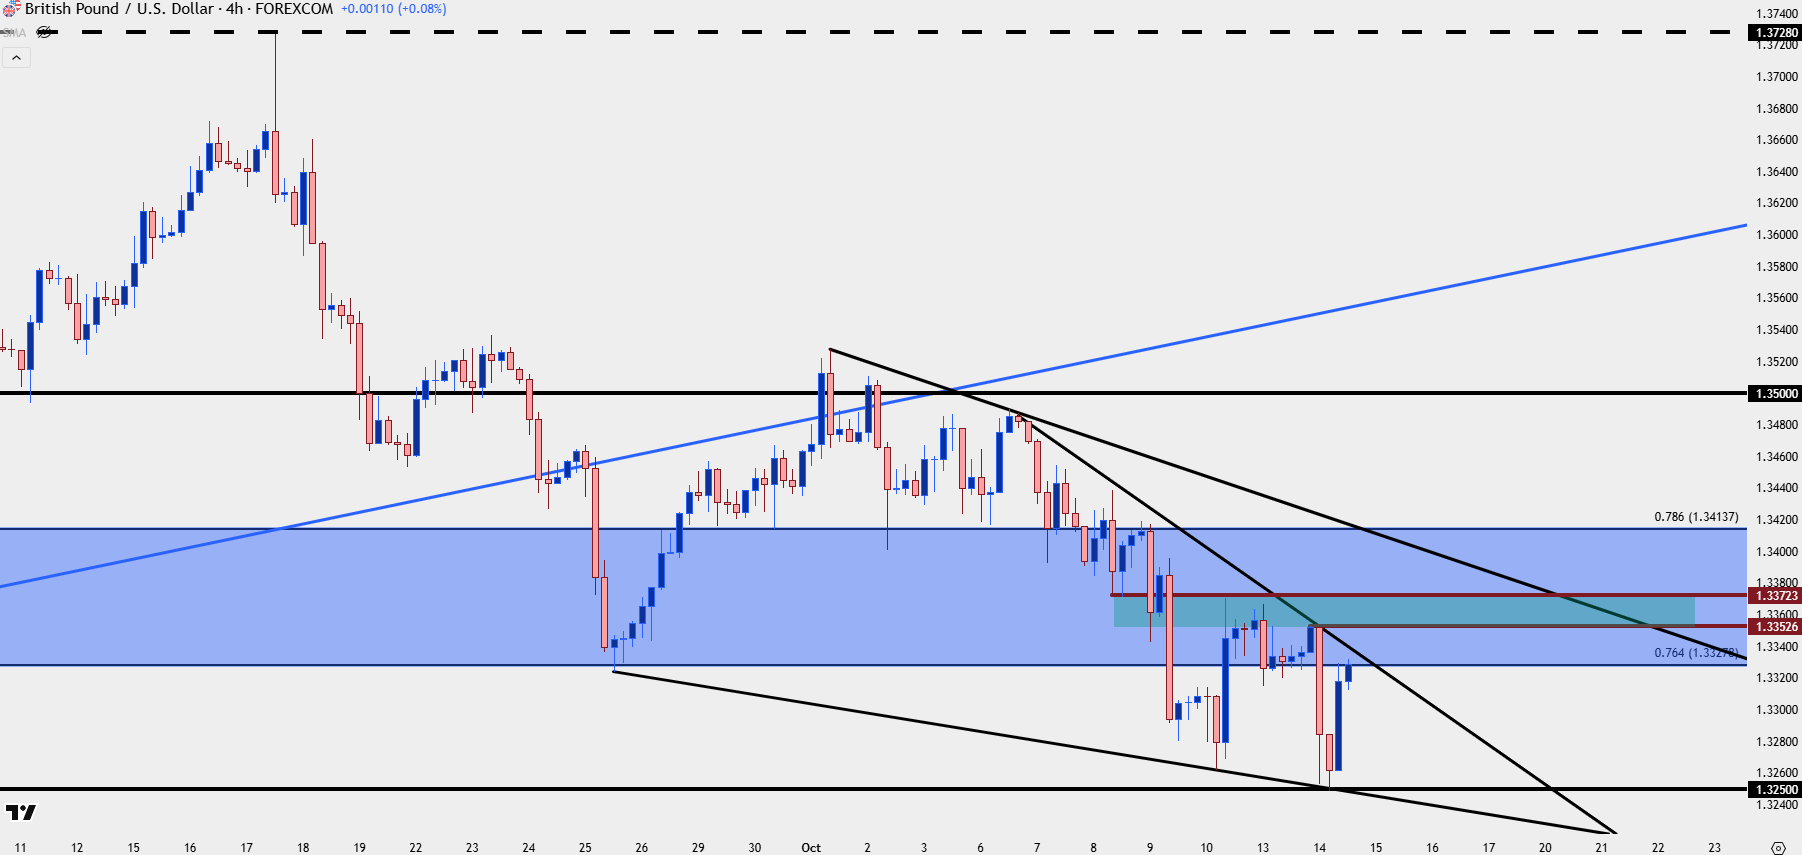
Chart prepared by James Stanley; data derived from Tradingview
USD/CAD
USD/CAD has remained one of the more attractive major pairs for USD-strength, and as I said in this webinar, the challenge at this point is the choice of chasing after the 1.4000 break.
In yesterday’s article I looked at a clean spot of support at 1.3980, which led to a higher-low into a higher-high. But, now that price is above the big figure, the challenge is inducing fresh longs and this can lead to pullback potential in the pair with the 1.4000 level now set up as support.
USD/CAD Four-Hour Chart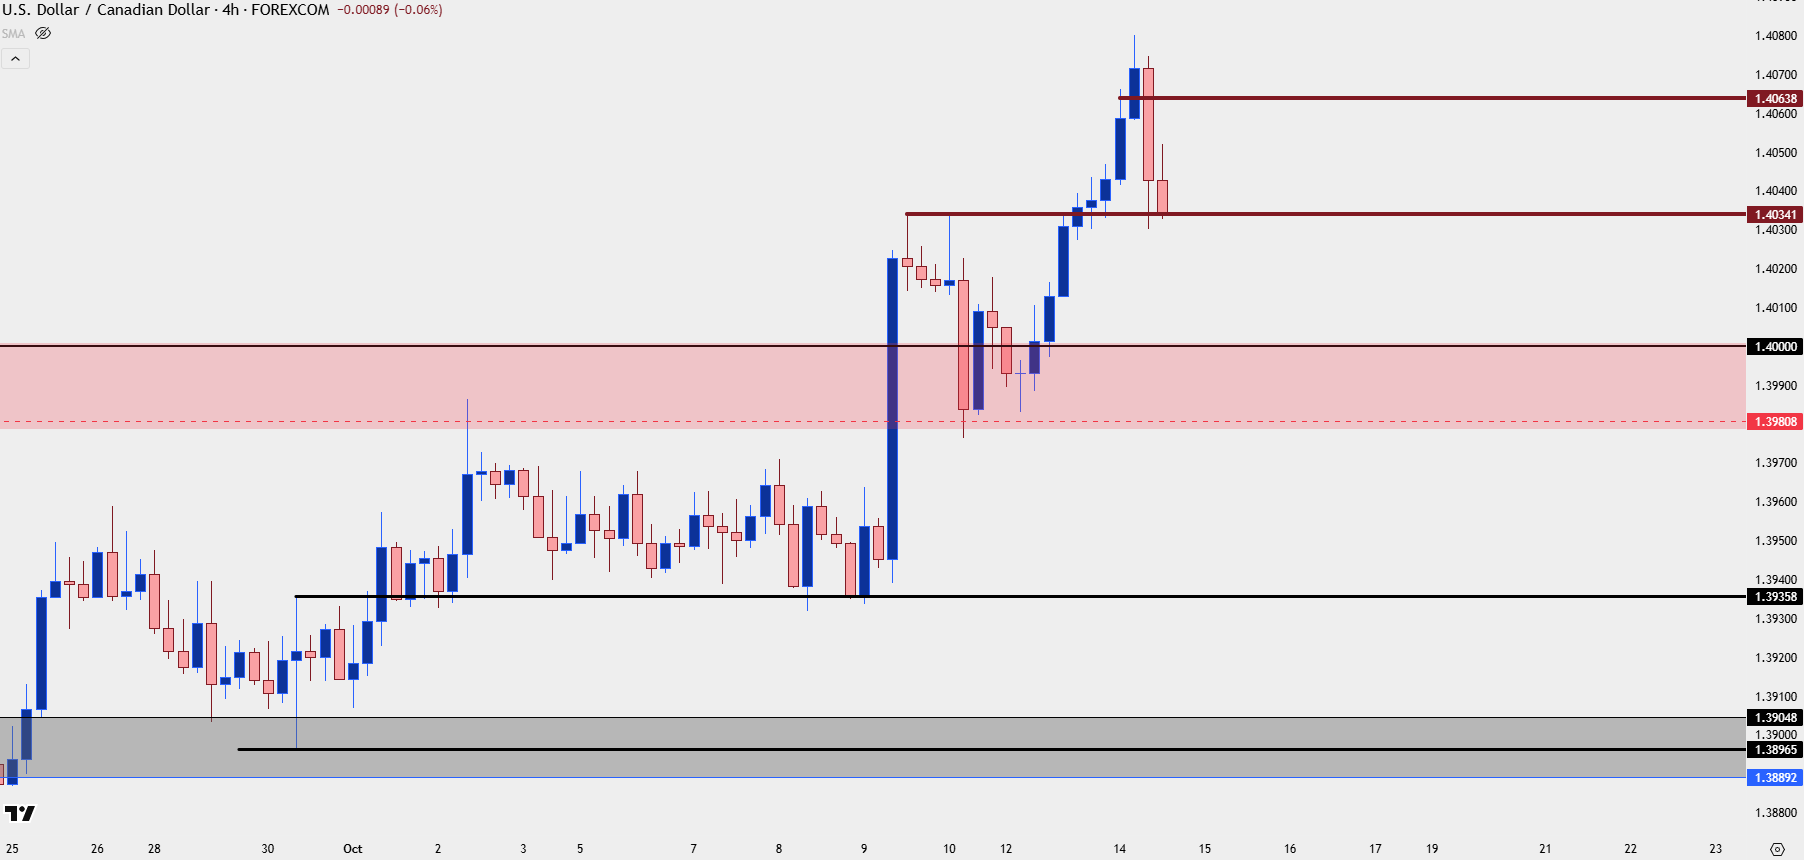
Chart prepared by James Stanley; data derived from Tradingview
USD/JPY
USD/JPY continued to carry large macro implications for USD trends but he setup at this point appears open for a deeper pullback. And if looking for Yen-weakness, I think EUR/JPY could make for a more amenable backdrop given current structure.
In USD/JPY, the bigger support tests are at 150.77 and then the 150.00 handle. But to put into scope the recent breakout, I’m tracking invalidation all the way down around 148.00, which is around where the 200-day moving average currently plots.
USD/JPY Daily Price Chart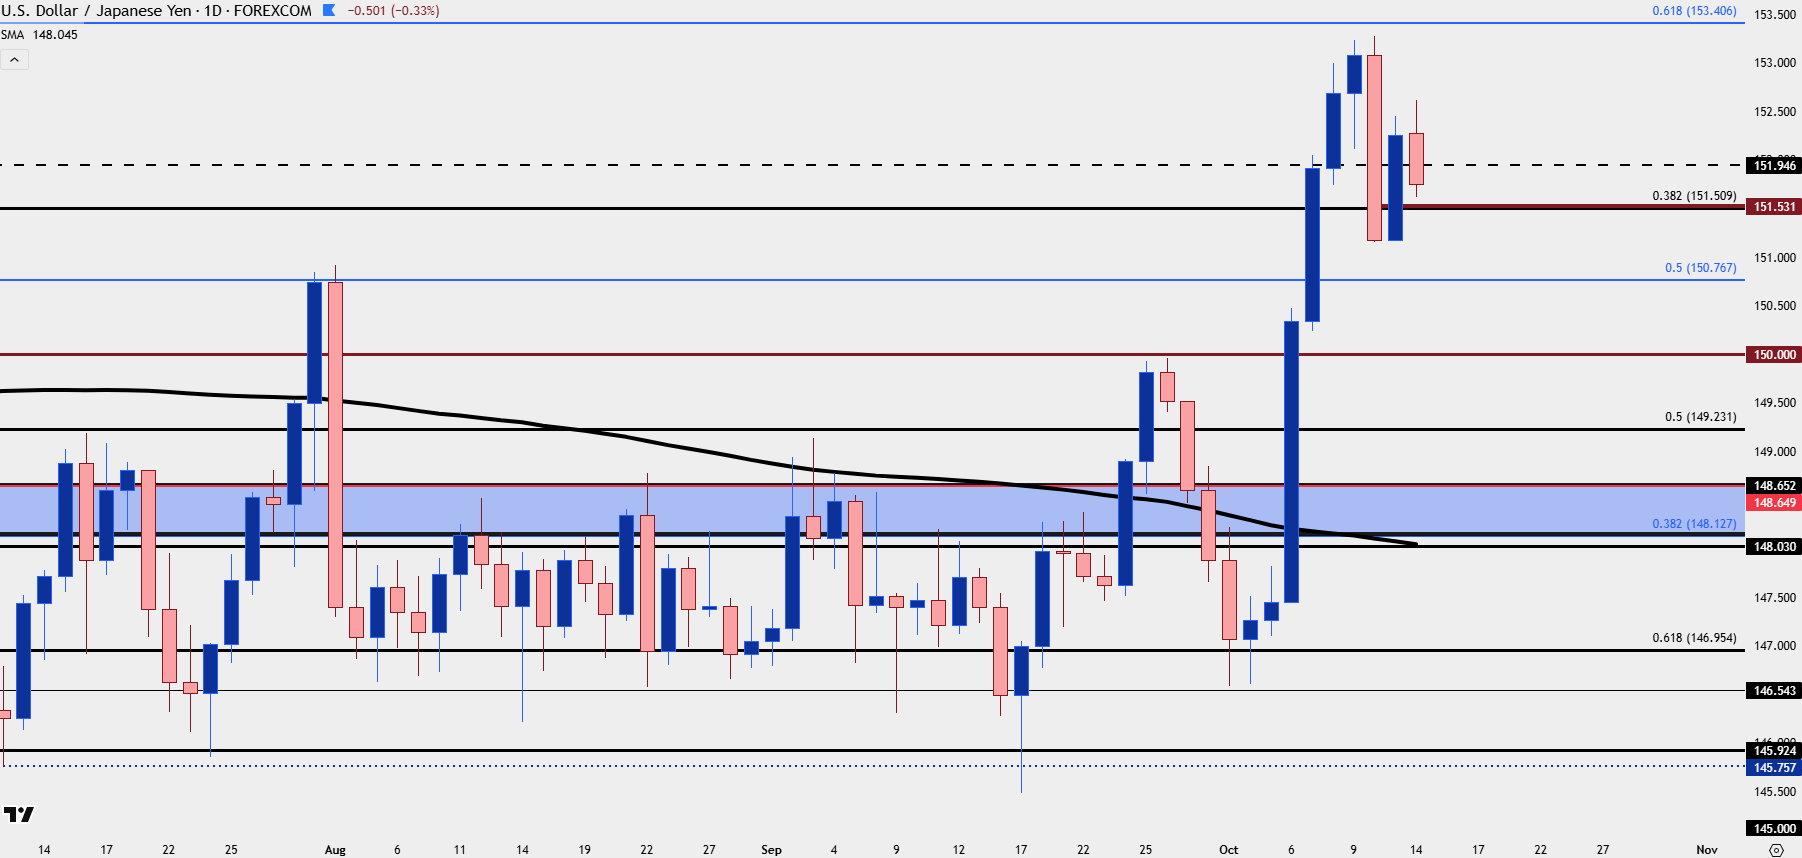
Chart prepared by James Stanley; data derived from Tradingview
--- written by James Stanley, Senior Strategist






