



Jackson Hole Returns: Nikkei 225 and Nasdaq 100 Volatility in Focus
Historical Jackson Hole returns point to elevated Nikkei 225 volatility around Fed speech day, with Nasdaq 100 direction hinging on Kevin Warsh.
Share this:

With US PCE inflation now behind us, attention turns squarely to Fed Chair Kevin Warsh’s Jackson Hole speech. Historical forward returns suggest volatility could remain elevated across the Nikkei 225 and Nasdaq 100 around the event, although direction will ultimately depend on how markets interpret Warsh’s policy message.
View related analysis:
View related analysis:
With US PCE inflation now behind us, attention turns squarely to Fed Chair Kevin Warsh’s keynote address at the Jackson Hole Economic Policy Symposium. Warsh is scheduled to speak at 00:00 Sydney time on Saturday, potentially encouraging more subdued trade beforehand — but with a clear risk of volatility expanding sharply should he deliver a meaningful shift in policy guidance.
This will be Warsh’s first Jackson Hole appearance as Fed Chair, and markets are still getting to grips with his communication style and policy reaction function. Traders will therefore be looking for clues on how he intends to steer monetary policy under different economic scenarios, where he sees the balance of risks, and what might prompt the Fed to change course. With Warsh so far reluctant to provide traditional forward guidance, the potential for markets to read heavily into his choice of words is arguably higher than usual.
Nikkei Volatility Peaks Around Fed Speech Day and T+1
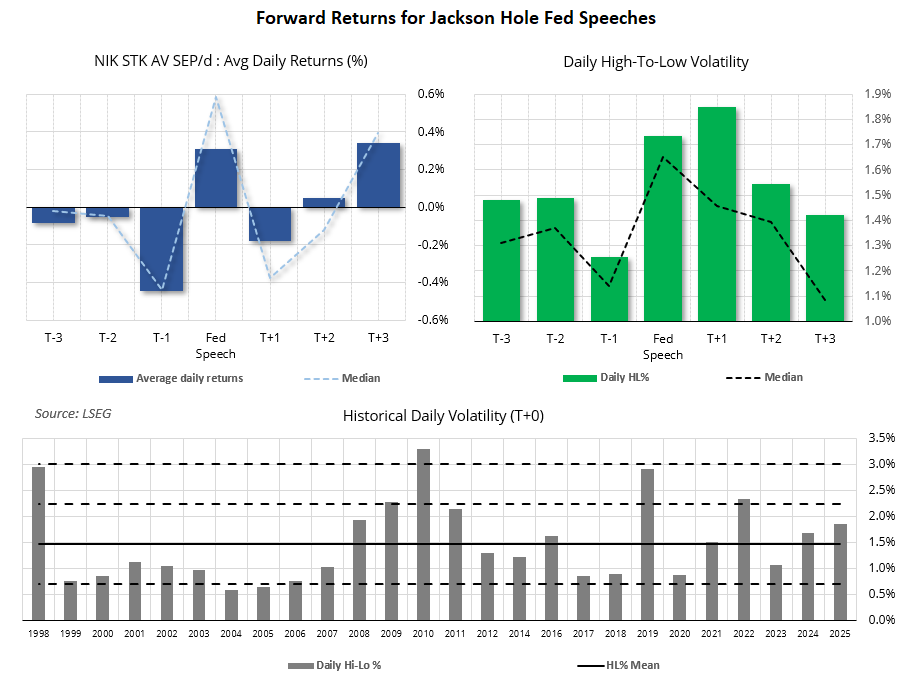
The forward returns charts show how Nikkei 225 futures have performed over the three trading days either side of Jackson Hole speeches. Given that the vast majority of Fed speeches since 1998 occurred on a Friday in European trading hours, we will assume T+1 represents the following Monday, T+2 the Tuesday, and so on.
Source: LSEG
- The clearest pattern is that volatility peaks on T+1, with an average high-to-low daily range of 1.85%. However, the median is considerably lower at 1.46%, suggesting a handful of outliers have pushed the average higher.
- Fed speech day is the second-most volatile session, with an average range of 1.74% and median of 1.65%. This suggests volatility has typically been elevated on the day itself, although several larger moves on the following Monday have pushed the T+1 average above it.
- Ultimately, today and Monday appear to have the greatest potential for Nikkei volatility based on this dataset.
Nikkei Returns Have Leaned Positive, but Policy Tone Remains Crucial
Fed speech day has also generated positive average returns of 0.31%, alongside a stronger median return of 0.6%.
While that is an interesting historical tendency, traders should not assume it provides a directional signal for this year. The reaction of the US dollar and broader risk appetite will ultimately depend on how hawkish or dovish the Fed Chair is perceived to be.
A hawkish speech would generally be expected to support the US dollar and weigh on risk appetite, potentially pressuring Wall Street indices and the Nikkei 225. Conversely, a relatively dovish — or simply less hawkish than expected — speech could support risk assets and the Nikkei while weighing on the US dollar.
Nasdaq 100 Eyes 30,000 After Nvidia Earnings
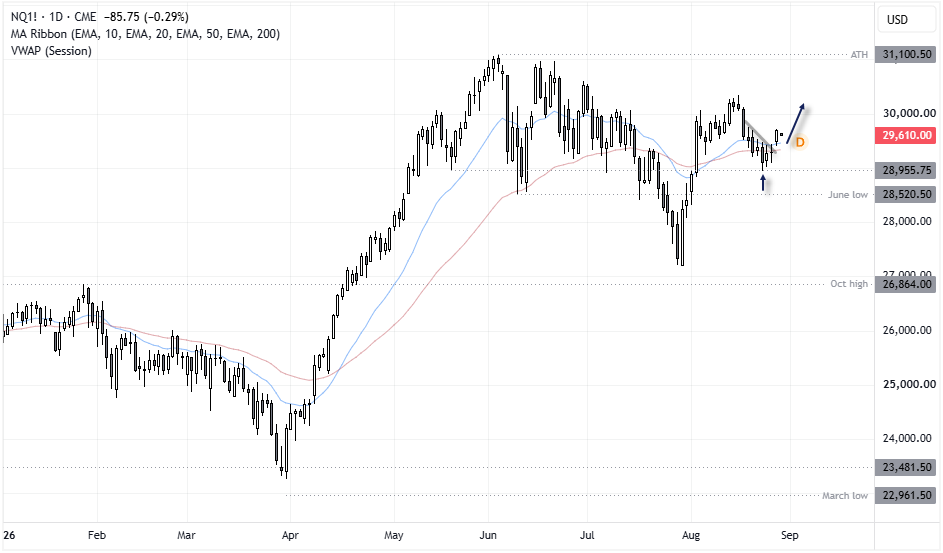
A strong performance from Nvidia following its earnings beat helped the Nasdaq 100 gap higher above its 20- and 50-day EMAs, putting 30,000 within striking distance.
Purely from a technical perspective, the Nasdaq looks capable of extending its rally after carving out a prominent low on Monday. But whether it can push materially higher from here is likely to come down to Kevin Warsh.
However, the Nasdaq does not currently share such a strong correlation with the Nikkei, with the 10-day reading sitting at just 0.21. Perhaps that positive correlation will strengthen again into next week, bringing it closer to the 0.84 and 0.79 readings seen over the 20- and 60-day lookbacks.
Source: CME, TradingView
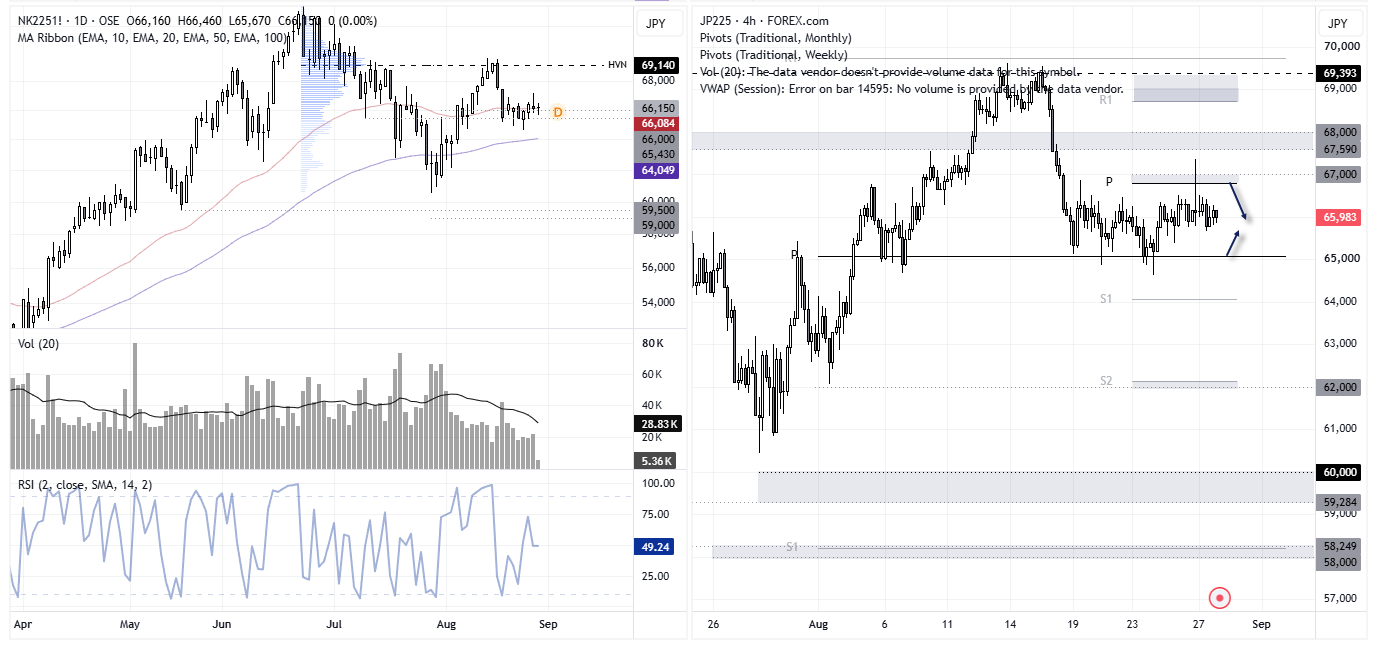
The daily futures chart (left) shows the Nikkei trying to grind higher, though it lacks the bullish enthusiasm seen on the Nasdaq overnight. Perhaps that will change after the open. However, daily trading volumes remain below average, which gives me less confidence in a meaningful move unless a fresh catalyst arrives.
The 4-hour chart shows choppy trade, with prices trapped between the monthly pivot point and weekly R1. Until we see a breakout, range-trading strategies may be preferred while prices remain between 65k and 67k. Otherwise, stepping aside until momentum tips its hand is always an option.
Source: SGX, Forex.com, TradingView
View the full economic calendar
View the full economic calendar
-- Written by Matt Simpson
Follow Matt on Twitter @cLeverEdge
How to trade with City Index
You can trade with City Index by following these four easy steps:
- Open an account, or log in if you’re already a customer
• Open an account in the UK
• Open an account in Australia
• Open an account in Singapore
- Search for the market you want to trade in our award-winning platform
- Choose your position and size, and your stop and limit levels
- Place the trade
Related tags:



Open an account in minutes
Experience award-winning platforms with fast and secure execution, and enjoy tight spreads from 0.5 pts on FX and 0.3 pts on indices.
Economic calendar
Web Trader platform
Our sophisticated web-based platform is packed with features.
Related articles
AUD/USD Bulls Fight Back After Australian Jobs Shock
AUD/USD has been hit by another ugly Australian employment report, sending RBA rate hike expectations sharply lower. Yet the relationships driving the currency have shifted since quarter-end, and improving risk appetite could provide the fuel for a recovery.

Bitcoin Bulls Eye Weekend Bounce as Nasdaq Finds Support
Bitcoin bulls eye a weekend bounce as Nasdaq finds support, BTC holds $80k and bullish reversal signals emerge alongside stronger correlations.

Gold outlook: Metal rebounds but downside risks persist
For now, at least, my near-term gold outlook remains modestly bearish, even if I have a strong long-term bullish bias towards gold and especially silver.

This report is intended for general circulation only. It should not be construed as a recommendation, or an offer (or solicitation of an offer) to buy or sell any financial products. The information provided does not take into account your specific investment objectives, financial situation or particular needs. Before you act on any recommendation that may be contained in this report, independent advice ought to be sought from a financial adviser regarding the suitability of the investment product, taking into account your specific investment objectives, financial situation or particular needs.
StoneX Financial Pte. Ltd., may distribute reports produced by its respective foreign entities or affiliates within the StoneX group of companies or third parties pursuant to an arrangement under Regulation 32C of the Financial Advisers Regulations. Where the report is distributed to a person in Singapore who is not an accredited investor, expert investor or an institutional investor (as defined in the Securities Futures Act), StoneX Financial Pte. Ltd. accepts legal responsibility to such persons for the contents of the report only to the extent required by law. Singapore recipients should contact StoneX Financial Pte. Ltd. at 6826 9988 for matters arising from, or in connection with the report.
In the case of all other recipients of this report, to the extent permitted by applicable laws and regulations neither StoneX Financial Pte. Ltd. nor its associated companies will be responsible or liable for any loss or damage incurred arising out of, or in connection with, any use of the information contained in this report and all such liability is hereby expressly disclaimed. No representation or warranty is made, express or implied, that the content of this report is complete or accurate.
StoneX Financial Pte. Ltd. is not under any obligation to update this report.
Trading CFDs carries a high level of risk that may not be suitable for some investors. Consider your investment objectives, level of experience, financial resources, risk appetite and other relevant circumstances carefully. The possibility exists that you could lose some or all of your investments, including your initial deposits. If in doubt, please seek independent expert advice. Visit www.forex.com/en-sg/terms-and-policies for the complete Risk Disclosure Statement.