



Japanese Yen Price Action Setups: USD/JPY, AUD/JPY, GBP/JPY
JPY pairs show mixed signals after the BOJ meeting, with USD/JPY stuck in range, AUD/JPY eyeing retracement, and GBP/JPY rejecting 200.
Share this:

Japanese yen pairs remain at pivotal technical levels following Friday’s BOJ meeting, which delivered no fresh policy clues from Governor Ueda. USD/JPY continues to trade within its established range, AUD/JPY shows signs of exhaustion after a sharp rally, and GBP/JPY faces resistance at the 200 milestone. Traders will be watching closely for confirmation of range breaks or retracements across these key JPY crosses.
View related analysis:
View related analysis:
Japanese Yen Technical Analysis: USD/JPY, AUD/JPY, GBP/JPY
USD/JPY Technical Analysis: US Dollar vs Japanese Yen
Friday’s Bank of Japan (BOJ) meeting failed to deliver a breakout for USD/JPY, with Governor Ueda offering no immediate clues on a potential rate hike in the coming months. As a result, USD/JPY remains confined to the 145.75–148.50 range it has traded within for most of the past two months.
A strong two-day rally leading into last week’s high could tip the balance towards an eventual bullish breakout, but one could argue it should have already occurred. Until a clear breakout takes place, the range remains valid, and range-trading strategies may be preferred.
The daily chart shows USD/JPY closed flat on Friday with a wide-legged doji near Thursday’s high. Monday’s false break of last week’s high resulted in a shooting star candle near the top of the range. Bears could seek to fade into retracements within Monday’s range and target the 147.19 low / daily S2 pivot or 147 handle.

Chart analysis by Matt Simpson - data source: TradingView USD/JPY


AUD/JPY Technical Analysis: Australian Dollar vs Japanese Yen
The strong rebound from the April low has carried AUD/JPY more than 14% higher, though early signs of a retracement are beginning to emerge. A bearish divergence formed on the weekly RSI (2) within overbought territory by last week’s close, and AUD/JPY snapped a three-week winning streak from arguably stretched levels. The BOJ’s decision to announce ETF and REIT sales saw AUD/JPY retest the July high, though it has so far managed to hold above the 97.24 high-volume node (HVN).
With an inverted hammer and inside day forming above Friday’s low and the HVN, a near-term bounce from current levels cannot be ruled out. However, a deeper pullback against the 14% rally remains possible, which could bring the 96.77 HVN or 96.31 near the 50% retracement level into focus.
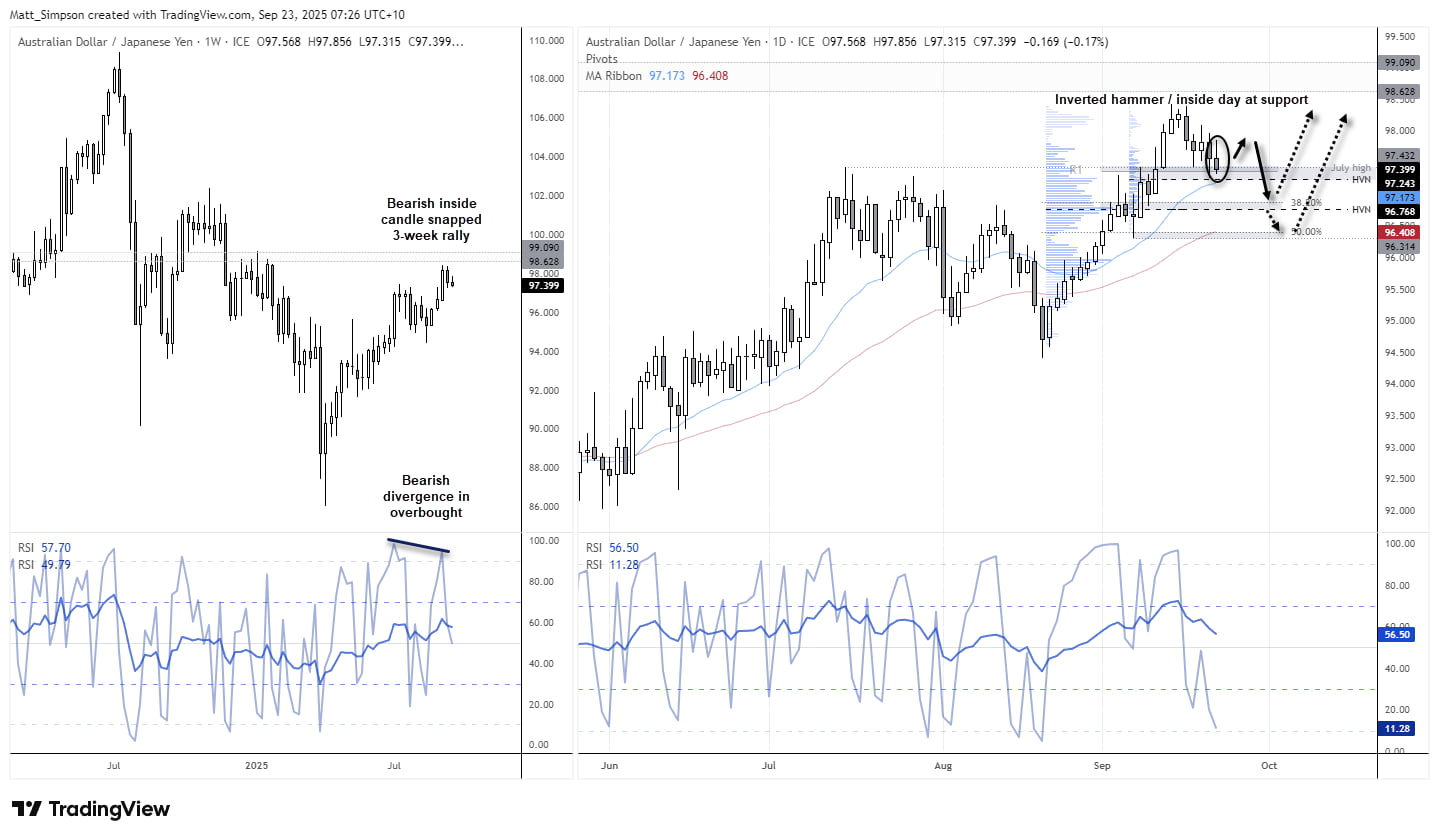
Chart analysis by Matt Simpson - data source: TradingView AUD/JPY
AUD/JPY Technical Analysis: 1-Hour Chart
The 1-hour chart shows volumes trending lower while prices declined towards the July high, which suggests bears may be losing momentum. Notably, volume spikes have coincided with two cycle lows around the July high and the 97.24 HVN, indicating that buyers stepped in at those levels.
Bulls may look to fade dips towards the HVN in anticipation of a countertrend bounce towards the 97.85 high and the nearby 200-bar SMA.
If such a bounce materialises, it will be important to reassess the potential for a swing high and resumption of the downtrend. Conversely, a direct break below the 97.20 area would assume bearish continuation, placing the 96.77 HVN into focus for sellers.
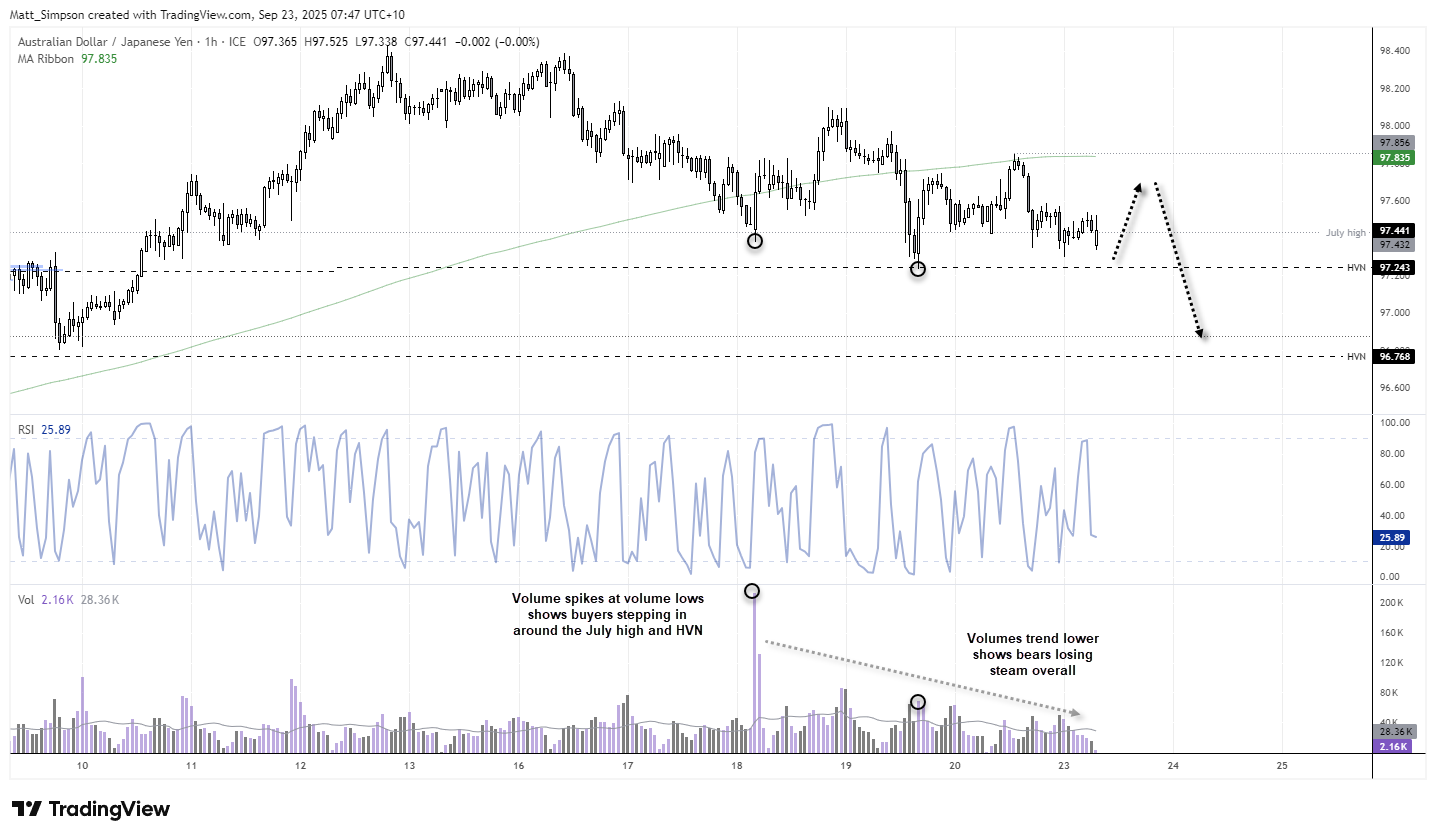
Chart analysis by Matt Simpson - data source: TradingView AUD/JPY


GBP/JPY Technical Analysis: British Pound vs Japanese Yen
The 200 level is clearly a major milestone for bulls to overcome, so it’s not surprising to see volatility increase around it. Despite three daily closes above 200 in the past week, GBP/JPY printed a shooting star followed by a bearish engulfing candle, which confirmed a close back below the 200 level and last Wednesday’s low.
With bears showing strength at cycle highs near such a key psychological level, they may look to fade any retracement within Friday’s bearish range.
A move towards 199 appears feasible, with a break beneath that level bringing the 197.87 low into focus.
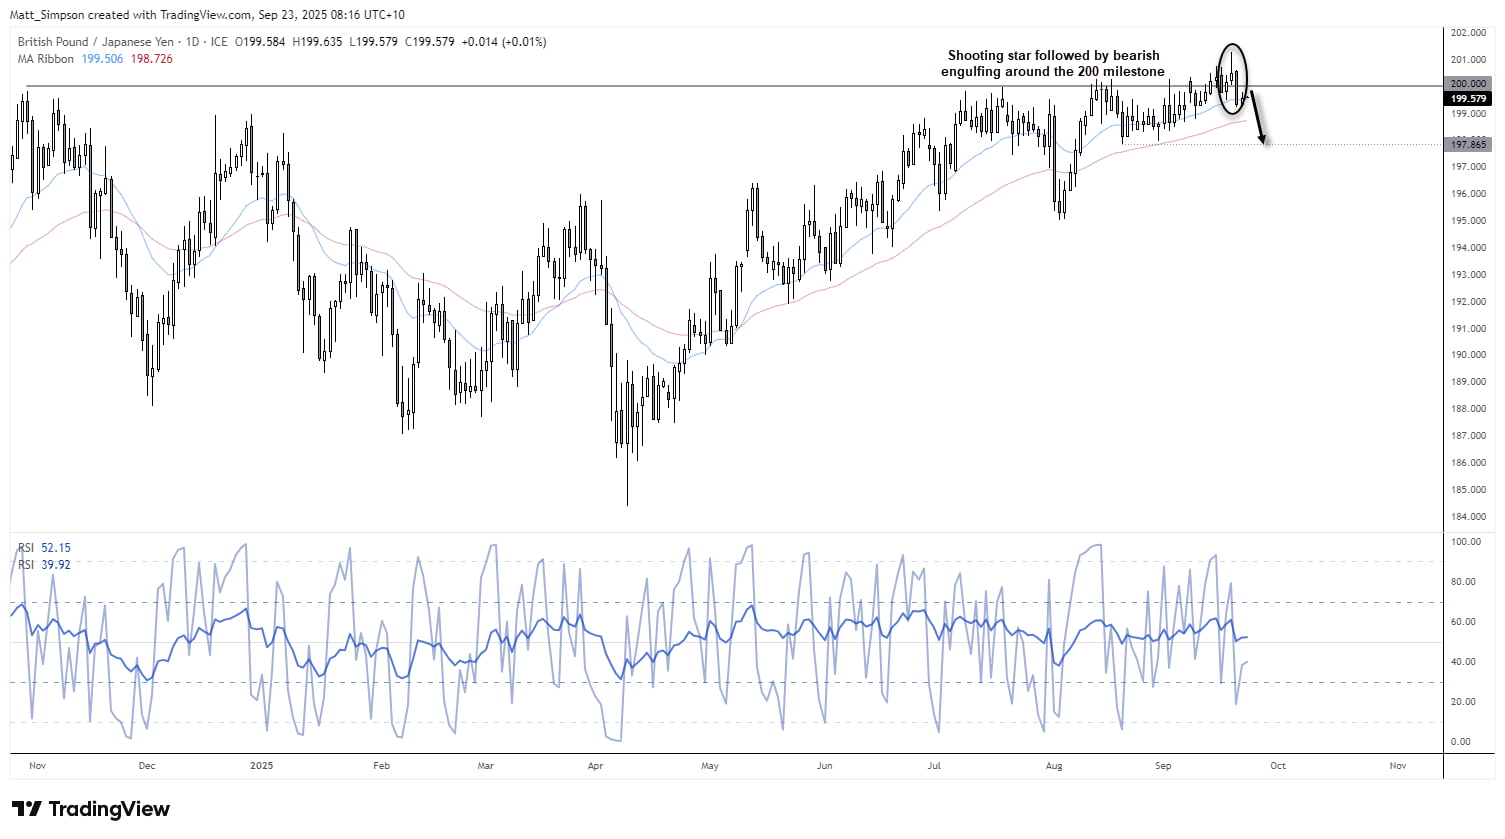
Chart analysis by Matt Simpson - data source: TradingView GBP/JPY
Key Economic Events for Traders (AEST / GMT+10)
All Day JPY Holiday – Autumn Equinox (USD/JPY, EUR/JPY, Nikkei 225)
00:00 EUR Consumer Confidence (Sep) (EUR/USD, EUR/GBP, DAX)
01:30 USD 3-Month Bill Auction, 6-Month Bill Auction (S&P 500, Nasdaq 100, USD/JPY)
02:00 USD FOMC Member Barkin Speaks (S&P 500, Nasdaq 100, USD/JPY)
02:00 EUR German Buba President Nagel Speaks (EUR/USD, EUR/GBP, DAX)
03:15 CAD BoC Senior Deputy Governor Rogers Speaks (USD/CAD, EUR/CAD, CAD/JPY)
03:30 EUR German Buba Balz Speaks (EUR/USD, EUR/GBP, DAX)
04:00 GBP BoE Gov Bailey Speaks (GBP/USD, EUR/GBP, GBP/JPY)
05:45 CAD BoC Deputy Gov Kozicki Speaks (USD/CAD, EUR/CAD, CAD/JPY)
08:00 KRW PPI (Aug) (USD/KRW, EUR/KRW, KRW/JPY)
09:00 AUD Manufacturing & Services PMI, Judo Bank Manufacturing PMI, Judo Bank Services PMI (Sep) (AUD/USD, AUD/JPY, AUD/NZD)
15:00 SGD CPI, Core CPI (Aug) (USD/SGD, EUR/SGD, SGD/JPY)
17:30 EUR HCOB Germany Composite PMI, Manufacturing PMI, Services PMI (Sep) (EUR/USD, EUR/GBP, DAX)
18:00 EUR HCOB Eurozone Composite PMI, Manufacturing PMI, Services PMI (Sep) (EUR/USD, EUR/GBP, DAX)
18:30 GBP S&P Global Composite PMI, Manufacturing PMI, Services PMI (Sep) (GBP/USD, EUR/GBP, GBP/JPY)
19:00 GBP BoE MPC Member Pill Speaks (GBP/USD, EUR/GBP, GBP/JPY)
19:30 EUR German 2-Year Schatz Auction (EUR/USD, EUR/GBP, DAX)
20:00 GBP CBI Industrial Trends Orders (Sep) (GBP/USD, EUR/GBP, FTSE 100)
22:30 USD Current Account (Q2) (S&P 500, Nasdaq 100, USD/JPY)
22:30 CAD New Housing Price Index (Aug) (USD/CAD, EUR/CAD, CAD/JPY)
22:55 USD Redbook (S&P 500, Nasdaq 100, USD/JPY)
23:00 USD FOMC Member Bowman Speaks (S&P 500, Nasdaq 100, USD/JPY)
23:45 USD S&P Global Manufacturing PMI, Composite PMI, Services PMI (Sep) (S&P 500, Nasdaq 100, USD/JPY)
00:00 USD FOMC Member Bostic Speaks (S&P 500, Nasdaq 100, USD/JPY)
00:00 USD Richmond Manufacturing Index, Shipments, Services Index (Sep) (S&P 500, Nasdaq 100, USD/JPY)
02:35 USD Fed Chair Powell Speaks (S&P 500, Nasdaq 100, USD/JPY)
03:00 USD 2-Year Note Auction (S&P 500, Nasdaq 100, USD/JPY)
03:00 USD M2 Money Supply (Aug) (S&P 500, Nasdaq 100, USD/JPY)


Open an account in minutes
Experience award-winning platforms with fast and secure execution, and enjoy tight spreads from 0.5 pts on FX and 0.3 pts on indices.
Economic calendar
Web Trader platform
Our sophisticated web-based platform is packed with features.
Related articles

USD/JPY Weekly Outlook: AI earnings could overshadow the Fed and BoJ
AI sentiment has become a major driver of US Treasury yields and USD/JPY. With Microsoft, Alphabet and Amazon reporting this week, central bank decisions may have competition for traders' attention.


USD/JPY Forecast: Is Rising Japanese Inflation Supporting the Yen?
As the trading week comes to an end, one of the most relevant developments in the FX market has been the renewed strength of the Japanese yen. This can be seen in the recent performance of USD/JPY, which has fallen nearly 1.0% over the last two trading sessions, highlighting a meaningful recovery in the Japanese currency against the U.S. dollar.


US Dollar Price Action Setups: EUR/USD, USD/JPY, GBP/USD, USD/CAD
The Dollar is working on its second consecutive red week and while sellers didn’t exactly pounce on fresh lows, there’s an opening door for bears to make a move.

This report is intended for general circulation only. It should not be construed as a recommendation, or an offer (or solicitation of an offer) to buy or sell any financial products. The information provided does not take into account your specific investment objectives, financial situation or particular needs. Before you act on any recommendation that may be contained in this report, independent advice ought to be sought from a financial adviser regarding the suitability of the investment product, taking into account your specific investment objectives, financial situation or particular needs.
StoneX Financial Pte. Ltd., may distribute reports produced by its respective foreign entities or affiliates within the StoneX group of companies or third parties pursuant to an arrangement under Regulation 32C of the Financial Advisers Regulations. Where the report is distributed to a person in Singapore who is not an accredited investor, expert investor or an institutional investor (as defined in the Securities Futures Act), StoneX Financial Pte. Ltd. accepts legal responsibility to such persons for the contents of the report only to the extent required by law. Singapore recipients should contact StoneX Financial Pte. Ltd. at 6826 9988 for matters arising from, or in connection with the report.
In the case of all other recipients of this report, to the extent permitted by applicable laws and regulations neither StoneX Financial Pte. Ltd. nor its associated companies will be responsible or liable for any loss or damage incurred arising out of, or in connection with, any use of the information contained in this report and all such liability is hereby expressly disclaimed. No representation or warranty is made, express or implied, that the content of this report is complete or accurate.
StoneX Financial Pte. Ltd. is not under any obligation to update this report.
Trading CFDs carries a high level of risk that may not be suitable for some investors. Consider your investment objectives, level of experience, financial resources, risk appetite and other relevant circumstances carefully. The possibility exists that you could lose some or all of your investments, including your initial deposits. If in doubt, please seek independent expert advice. Visit www.forex.com/en-sg/terms-and-policies for the complete Risk Disclosure Statement.