


Japanese Yen Technical Outlook: USD/JPY, CHF/JPY, AUD/JPY
Yen weakness persists across the majors, with USD/JPY, CHF/JPY and AUD/JPY all eyeing further upside despite short-term pullbacks.
Share this:

The Japanese yen continues to underperform across the FX board, with most major yen crosses extending their broader uptrends into mid-December. While short-term pullbacks have emerged, the underlying technical bias for USD/JPY, CHF/JPY and AUD/JPY remains constructive — helped along by favourable seasonality and steady demand for higher-yielding currencies. Traders should still stay nimble, with several crosses sitting near key resistance levels where volatility can flare.
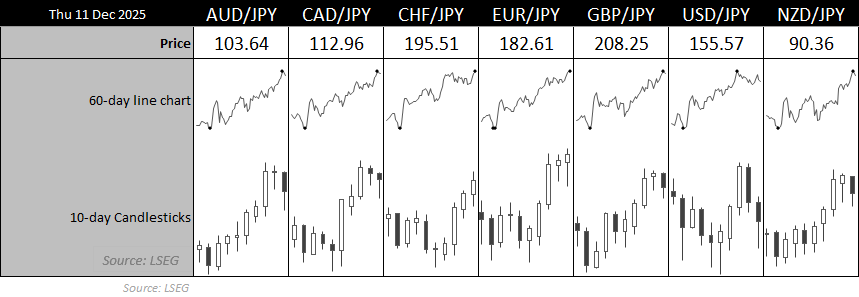
Chart analysis by Matt Simpson - data source: LSEG
View related analysis:
View related analysis:
Technical Setups for USD/JPY, CHF/JPY and AUD/JPY
USD/JPY Technical Analysis: US Dollar vs Japanese Yen
The US dollar pulled back against the yen for a second straight session, though a late recovery on Thursday produced a bullish hammer on the daily USD/JPY chart. The lower wick held perfectly at the 155 handle — a level previously watched for potential MOF intervention — which bolsters the near-term bullish case.
On the 1-hour chart, volumes increased during the decline, but the small bullish candle at the cycle low printed on the highest volume of the session. That points to a sentiment shift at the intraday low — which aligns with the daily hammer’s wick — and underpins today’s constructive bias for USD/JPY.
Bulls may look for dips within Thursday’s range ahead of a potential break above 156. Still, with seasonal US-dollar weakness typically emerging in the second half of December, traders should stay nimble.
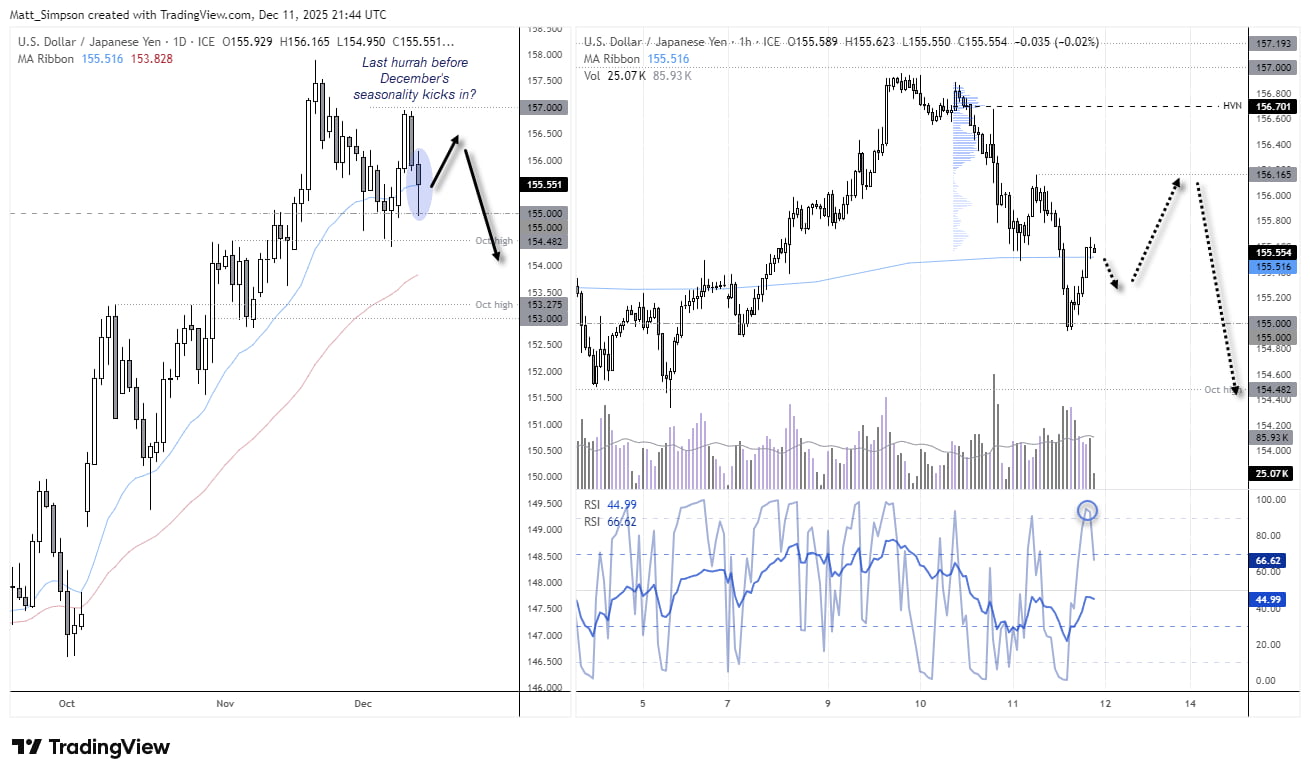
Chart analysis by Matt Simpson - data source: TradingView USD/JPY


CHF/JPY Technical Analysis: Swiss Franc vs Japanese Yen
The uptrend on CHF/JPY remains relentless, with the Swiss franc now pressing towards a fresh record high against the yen. The pair is tracking a fourth consecutive daily gain, and with December seasonality strongly skewed to the upside, dips continue to look attractive into the new year.
Given the strength of momentum and the seasonal tailwind, CHF/JPY bulls are likely eyeing the 200 handle. Whether it reaches that level by month-end is uncertain — but December’s historical performance suggests it has a fair chance of attempting it.
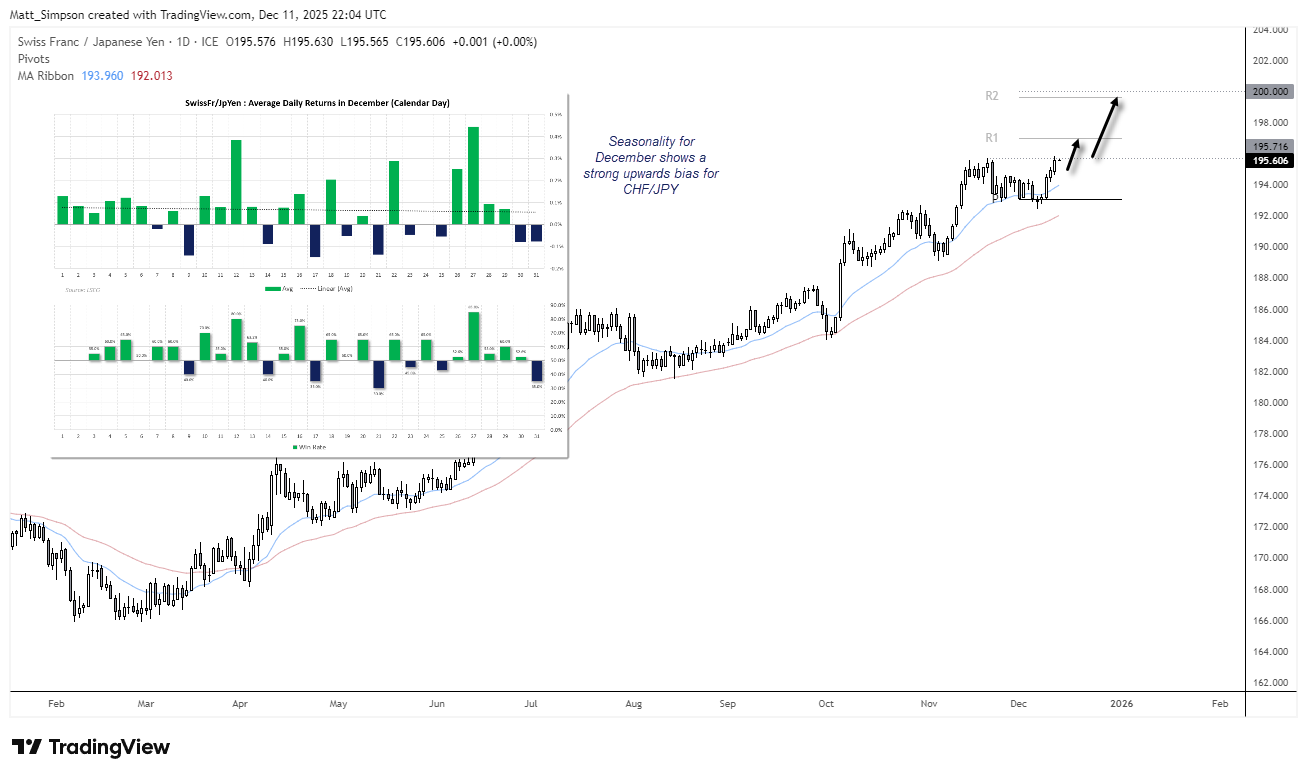
Chart analysis by Matt Simpson - data source: TradingView CHF/JPY


AUD/JPY Technical Analysis: Australian Dollar vs Japanese Yen
AUD/JPY is another yen cross that typically performs well in December, but the latest rally has stalled just beneath the 2008 high, triggering a short-term pullback. A bit more downside looks likely before bulls attempt to drive the next leg higher — unless an anti-seasonal risk-off move derails it.
On the 1-hour chart, a double top has formed around prior support at 103.78, with declining volumes into Thursday’s high reinforcing the loss of momentum. Bulls may look for dips within Thursday’s range while price holds above the double-bottom lows around the 103.17 high-volume node, anticipating a break back above 103.8.
Still, traders should be alert to the possibility of a deeper retracement towards 102.85 or even 102.50 before the broader upswing resumes.
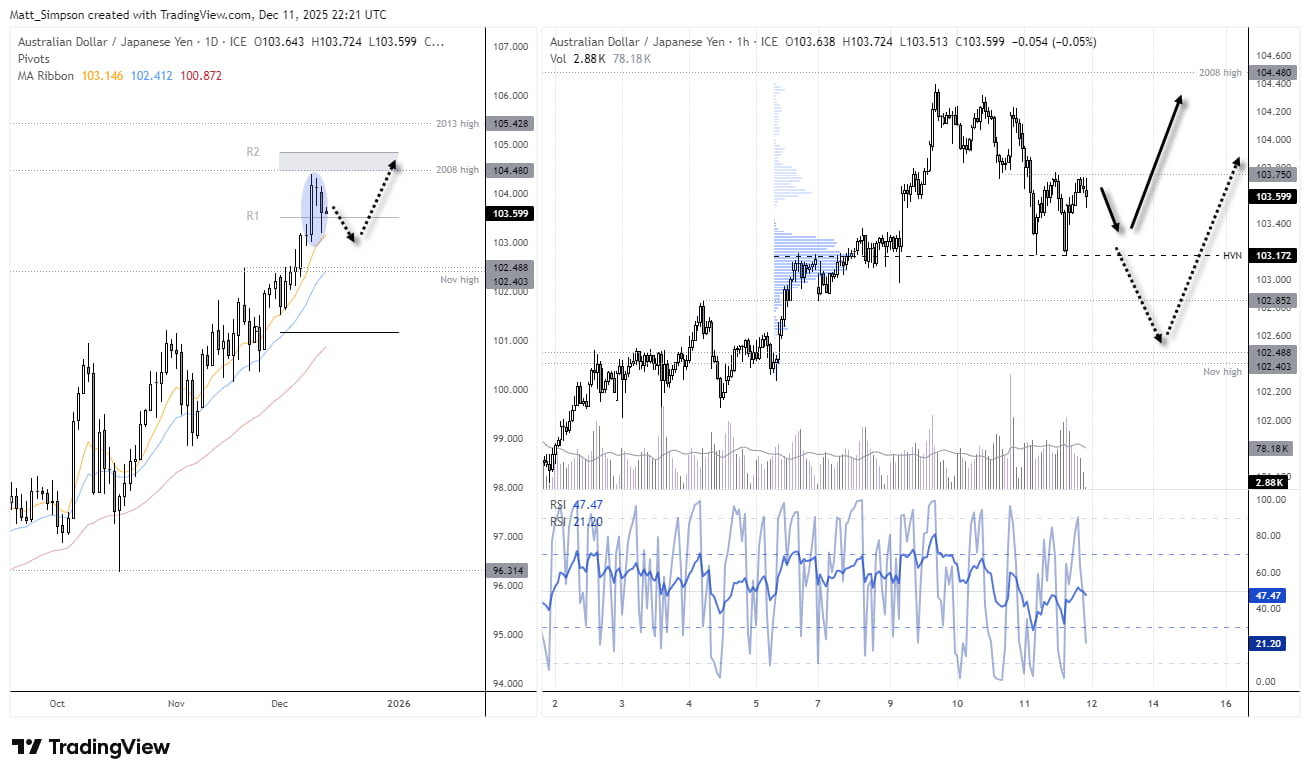
Chart analysis by Matt Simpson - source: TradingView AUD/JPY
View the full economic calendar
View the full economic calendar
-- Written by Matt Simpson
Follow Matt on Twitter @cLeverEdge
How to trade with City Index
You can trade with City Index by following these four easy steps:
- Open an account, or log in if you’re already a customer
• Open an account in the UK
• Open an account in Australia
• Open an account in Singapore
- Search for the market you want to trade in our award-winning platform
- Choose your position and size, and your stop and limit levels
- Place the trade
Related tags:
Latest market news




Open an account in minutes
Experience award-winning platforms with fast and secure execution, and enjoy tight spreads from 0.5 pts on FX and 0.3 pts on indices.
Economic calendar
Web Trader platform
Our sophisticated web-based platform is packed with features.
Related articles
US Dollar Bulls Hold Firm, but Euro Warns of Squeeze Risk | COT Report
US dollar bulls remain firmly positioned, but record euro shorts have failed to break EUR/USD support, raising the risk of a short-covering rally.
USD/CAD reversal risk builds as central bank showdown looms
USD/CAD has delivered a bullish reversal signal from established support, just as traders prepare for Fed and BoC decisions. Aggressive Canadian rate hike expectations and conflicting momentum signals make the coming session important.

Australian Dollar Outlook: AUD/USD Screams Sentiment Extreme Into Fed, CPI
AUD/USD rebounds despite record bearish futures positioning, with Australian Q3 CPI and the Fed meeting threatening to trigger another short squeeze.
This report is intended for general circulation only. It should not be construed as a recommendation, or an offer (or solicitation of an offer) to buy or sell any financial products. The information provided does not take into account your specific investment objectives, financial situation or particular needs. Before you act on any recommendation that may be contained in this report, independent advice ought to be sought from a financial adviser regarding the suitability of the investment product, taking into account your specific investment objectives, financial situation or particular needs.
StoneX Financial Pte. Ltd., may distribute reports produced by its respective foreign entities or affiliates within the StoneX group of companies or third parties pursuant to an arrangement under Regulation 32C of the Financial Advisers Regulations. Where the report is distributed to a person in Singapore who is not an accredited investor, expert investor or an institutional investor (as defined in the Securities Futures Act), StoneX Financial Pte. Ltd. accepts legal responsibility to such persons for the contents of the report only to the extent required by law. Singapore recipients should contact StoneX Financial Pte. Ltd. at 6826 9988 for matters arising from, or in connection with the report.
In the case of all other recipients of this report, to the extent permitted by applicable laws and regulations neither StoneX Financial Pte. Ltd. nor its associated companies will be responsible or liable for any loss or damage incurred arising out of, or in connection with, any use of the information contained in this report and all such liability is hereby expressly disclaimed. No representation or warranty is made, express or implied, that the content of this report is complete or accurate.
StoneX Financial Pte. Ltd. is not under any obligation to update this report.
Trading CFDs carries a high level of risk that may not be suitable for some investors. Consider your investment objectives, level of experience, financial resources, risk appetite and other relevant circumstances carefully. The possibility exists that you could lose some or all of your investments, including your initial deposits. If in doubt, please seek independent expert advice. Visit www.forex.com/en-sg/terms-and-policies for the complete Risk Disclosure Statement.