


Nasdaq 100 Leads Risk-Off as Tech Earnings Weigh, Gold Slides
Nasdaq 100 futures slide on weak tech earnings as gold, WTI crude and AUD retreat in broad risk-off trade ahead of US inflation data.
Share this:
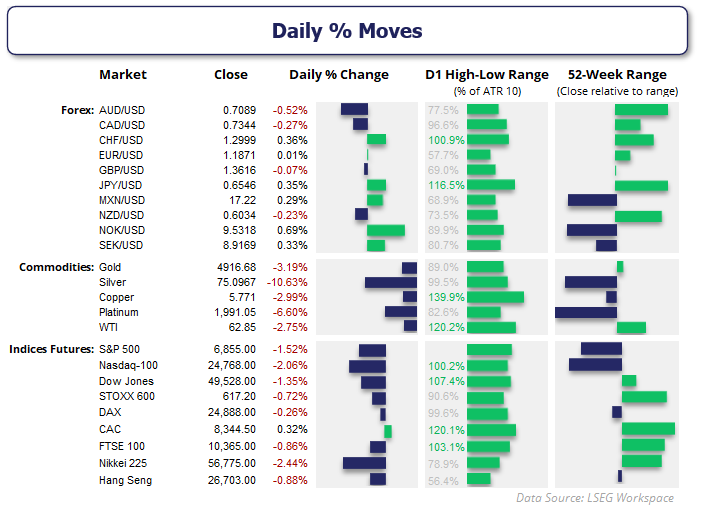
Risk appetite deteriorated across global markets ahead of a key US inflation report, with the Nasdaq 100 leading losses as tech earnings disappointed. Precious metals and WTI crude oil were dragged lower, while traditional safe havens such as the Swiss franc and Japanese yen outperformed. With S&P 500, Dow Jones and Nasdaq 100 futures now testing key technical levels, traders face an important inflection point across equities and gold.
View related analysis:
View related analysis:
Nasdaq 100 Futures Slide as Tech Earnings Trigger Risk-Off, Gold Under Pressure
A bout of risk-off emerged across Wall Street indices and precious metals on Thursday ahead of a key US inflation report. Renewed concerns over technology sector profits saw the Nasdaq 100 lead the declines, with futures down -1.9% at the time of writing.
Cisco (CSCO) shares plunged more than -13% after posting lower-than-expected margins, squeezed by surging RAM prices. Its -6.9% opening gap was the most bearish since November 2023, and the stock is on track to form a bearish outside week.
Risk-Off Drives Gold, WTI Crude Oil and FX Volatility as AUD Lags, CHF and JPY Outperform
- Apple shares (AAPL) were off -5.3%, while Palantir (PLTR) fell -4.8%.
- AppLovin (APP) was the Nasdaq’s worst performer after weak Q4 results, dropping -18.5% at the time of writing.
- Precious metals were also caught in the commotion, with gold falling -3% and hinting at a dead cat bounce
- WTI crude oil was dragged lower amid the risk-off trade, with bears potentially eyeing a break below $62.
- The Australian dollar (AUD) was the weakest FX major, likely feeling the pinch of profit-taking after an extended rally despite lingering fundamental reasons to fade it.
- The Swiss franc (CHF) and Japanese yen (JPY) were the strongest FX majors during the risk-off session.
Source: LSEG
Wall Street Futures Technical Analysis: S&P 500, Nasdaq 100, Dow Jones
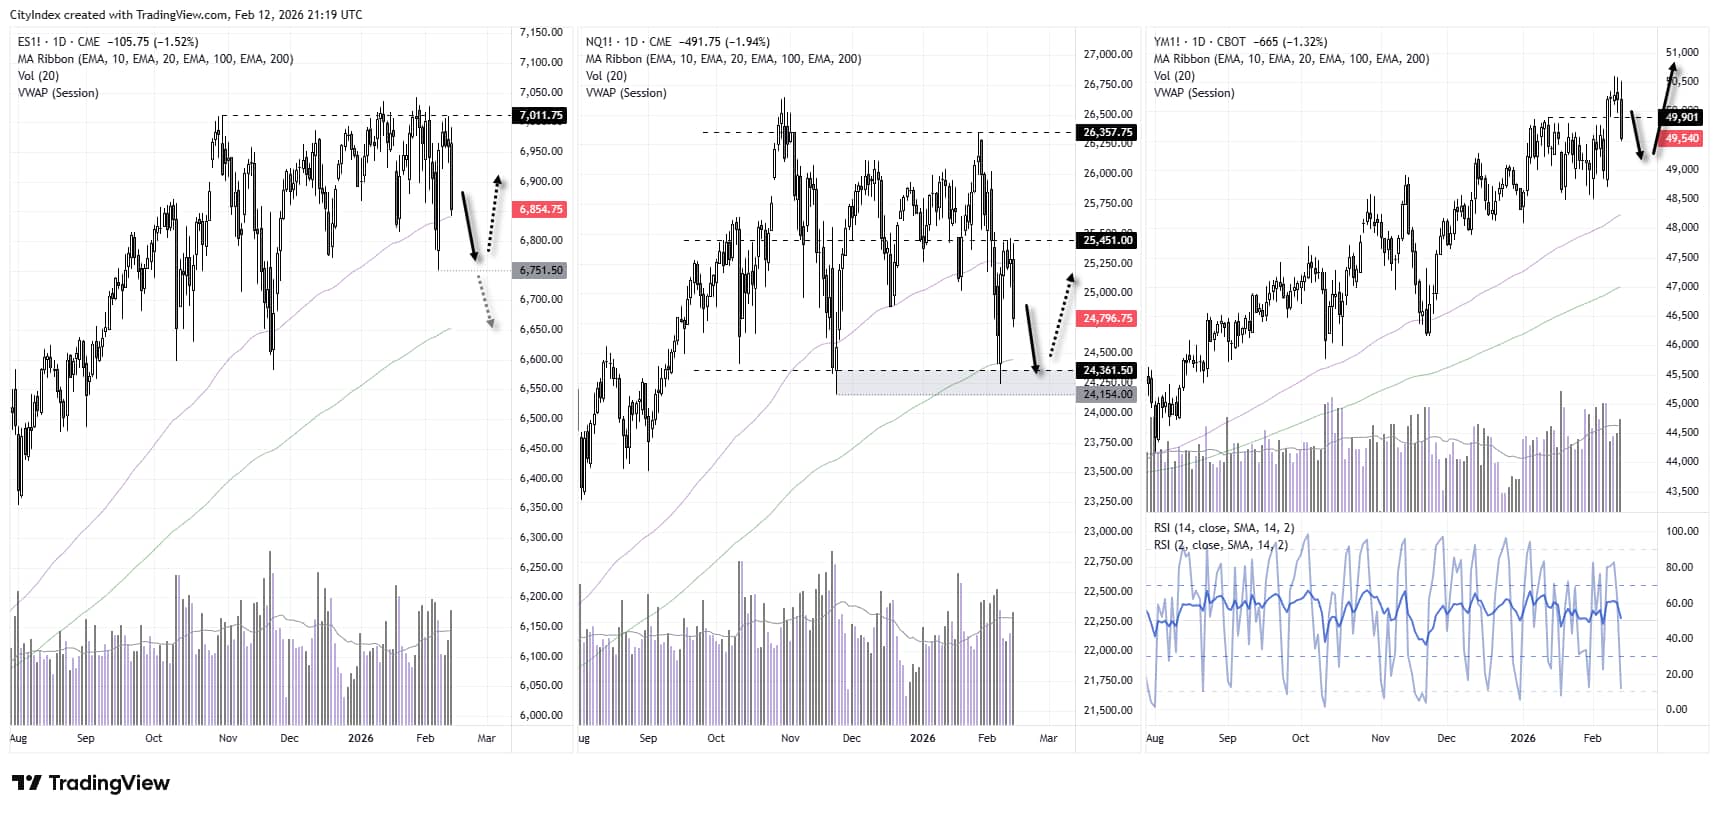
Momentum has clearly turned against Wall Street bulls, although the pullback did not come without warning. Earlier in the week, I noted that Dow Jones futures looked tired above 50k, the S&P 500 was struggling near its cycle highs, and the Nasdaq 100’s rebound had faltered within its own messy range.
In a separate video, I outlined my preference for the Nasdaq 100 to lead any downside move should a bout of risk-off emerge — which is precisely what has unfolded.
Source: TradingView, CME


S&P 500 Futures (ES) Technical Analysis
Bulls repeatedly made hard work of a breakout above 7,000, with a series of low-volatility candles printing upper wicks and forming a lower high around that key level. With a clear break below 6,900, bulls are now clinging to the 100-day EMA for support — a break beneath it brings the February low (6,750.5) into focus.
Nasdaq 100 Futures (NQ) Technical Analysis
While the Nasdaq 100 also printed low-volatility candles near resistance, its lower high formed considerably further below its record high relative to the S&P 500. Bulls attempted — but failed — to reclaim the 100-day EMA from below, with bearish momentum ultimately prevailing.
Given the Nasdaq 100 has led the downside move during this bout of risk-off, it remains my preferred short bias of the three, bringing the 200-day EMA (24,451) and cycle lows just above 24,000 into focus.
Dow Jones Futures (YM) Technical Analysis
The Dow Jones remains the leader of the pack, which in my view makes it less attractive for bears during pullbacks. It retains a clearly bullish trend structure on the daily chart, making it a market to monitor for potential long setups — should evidence of a swing low emerge.
Ideally, we want to see all three indices confirm one another, but for now I assume the Dow would outperform the S&P 500 and Nasdaq 100 if risk appetite returns.


Gold Futures (GC) Technical Analysis
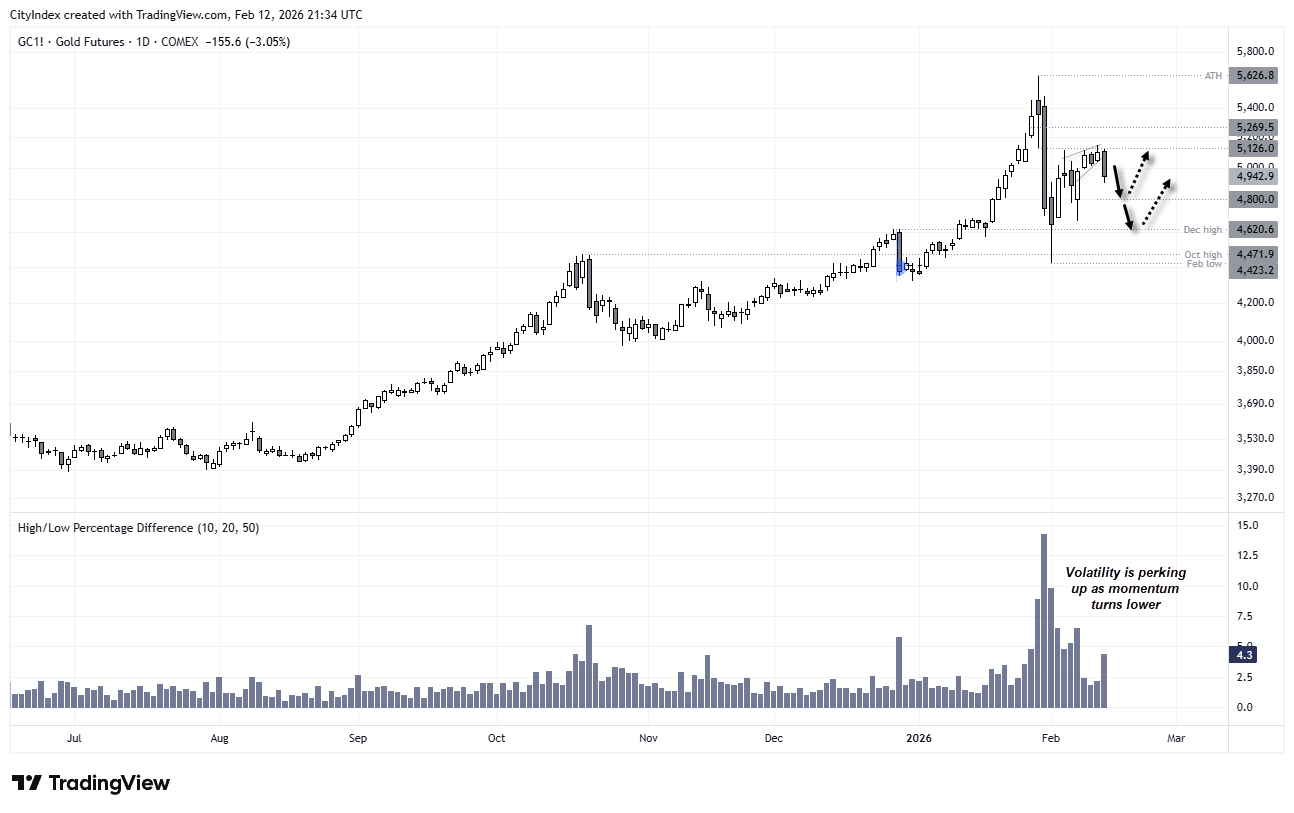
Yesterday I warned that gold may have been setting up to roll over as part of a dead cat bounce, and Thursday’s sell-off suggests the tide may be turning. However, a true dead cat bounce would require gold prices to take out the February low.
Clues from futures market positioning suggest any pullback could prove limited. For now, a move down to 4,800 could be on the cards for gold bears — a break below that level brings the December high (4,620) into focus.
Source: TradingView, CME
View the full economic calendar
View the full economic calendar
-- Written by Matt Simpson
Follow Matt on Twitter @cLeverEdge
How to trade with City Index
You can trade with City Index by following these four easy steps:
- Open an account, or log in if you’re already a customer
• Open an account in the UK
• Open an account in Australia
• Open an account in Singapore
- Search for the market you want to trade in our award-winning platform
- Choose your position and size, and your stop and limit levels
- Place the trade
Related tags:



Open an account in minutes
Experience award-winning platforms with fast and secure execution, and enjoy tight spreads from 0.5 pts on FX and 0.3 pts on indices.
Economic calendar
Web Trader platform
Our sophisticated web-based platform is packed with features.
Related articles
Australian Dollar Outlook: AUD/USD Screams Sentiment Extreme Into Fed, CPI
AUD/USD rebounds despite record bearish futures positioning, with Australian Q3 CPI and the Fed meeting threatening to trigger another short squeeze.

Gold Does Something it Hasn’t Done in a Year, is Larger Risk-Off Afoot?
With tech stocks getting hit harder last week there was collateral damage elsewhere, including gold as the metal closed below the $4k level for the week and that’s the first time that’s happened to spot gold in more than a year.


Silver forecast: metals liquidation drags XAG/USD into $50-55 support
Silver has broken its July low and slipped into a long-term support zone as the selling in precious metals deepens. The chart shows where the metal could bottom, and next week's Fed decision may decide whether it does.

This report is intended for general circulation only. It should not be construed as a recommendation, or an offer (or solicitation of an offer) to buy or sell any financial products. The information provided does not take into account your specific investment objectives, financial situation or particular needs. Before you act on any recommendation that may be contained in this report, independent advice ought to be sought from a financial adviser regarding the suitability of the investment product, taking into account your specific investment objectives, financial situation or particular needs.
StoneX Financial Pte. Ltd., may distribute reports produced by its respective foreign entities or affiliates within the StoneX group of companies or third parties pursuant to an arrangement under Regulation 32C of the Financial Advisers Regulations. Where the report is distributed to a person in Singapore who is not an accredited investor, expert investor or an institutional investor (as defined in the Securities Futures Act), StoneX Financial Pte. Ltd. accepts legal responsibility to such persons for the contents of the report only to the extent required by law. Singapore recipients should contact StoneX Financial Pte. Ltd. at 6826 9988 for matters arising from, or in connection with the report.
In the case of all other recipients of this report, to the extent permitted by applicable laws and regulations neither StoneX Financial Pte. Ltd. nor its associated companies will be responsible or liable for any loss or damage incurred arising out of, or in connection with, any use of the information contained in this report and all such liability is hereby expressly disclaimed. No representation or warranty is made, express or implied, that the content of this report is complete or accurate.
StoneX Financial Pte. Ltd. is not under any obligation to update this report.
Trading CFDs carries a high level of risk that may not be suitable for some investors. Consider your investment objectives, level of experience, financial resources, risk appetite and other relevant circumstances carefully. The possibility exists that you could lose some or all of your investments, including your initial deposits. If in doubt, please seek independent expert advice. Visit www.forex.com/en-sg/terms-and-policies for the complete Risk Disclosure Statement.