





Nasdaq 100 Outlook: Bullish Momentum Stalls Around the 20,000 Level
Over the past 10 trading sessions, the Nasdaq 100 index has shown a strong recovery, gaining more than 13%, driven in part by easing trade tensions between the United States and China, which has helped restore short-term market confidence.
Share this:

Over the past 10 trading sessions, the Nasdaq 100 index has shown a strong recovery, gaining more than 13%, driven in part by easing trade tensions between the United States and China, which has helped restore short-term market confidence. However, a phase of neutral price action has recently emerged as markets await the next decision from the Federal Reserve.
How is the trade war evolving?
Currently, a 145% tariff remains in place on goods imported from China, as part of the White House's measures to protect the U.S. economy. However, recent comments from President Trump have been interpreted by markets as a possible sign of easing tensions, which could improve short-term investor sentiment toward U.S. equities.
China, for its part, has indicated that it would be reasonable to eliminate the existing tariffs in order to move forward with negotiations and reach an agreement. Still, the U.S. has not announced an official date to begin reducing tariffs.
This issue directly affects the Nasdaq 100, which is heavily exposed to global technology companies like Apple, Microsoft, and Nvidia. Many of these companies rely on supply chains, sales, or manufacturing operations in China. Therefore, higher tariffs could increase operating costs and reduce profitability, negatively impacting overall confidence in the index.
In this scenario, a concrete trade agreement between the U.S. and China could boost market confidence and support the current bullish pressure in the Nasdaq 100. However, if negotiations continue without meaningful progress, it could be perceived as a negative signal for bilateral cooperation, potentially reviving the uncertainty that dominated the early part of the year.
How is market sentiment holding up?
The AAII Investor Sentiment Survey, which gauges investor expectations for the next six months, revealed in its most recent reading (as of April 30) that 20.9% of respondents are bullish, 19.8% are neutral, and 59.3% hold a bearish outlook on the market.

Source: AAII
This reflects a predominantly bearish sentiment, likely due to the lack of a clear resolution to the trade dispute. If confidence fails to stabilize, investors may seek safer assets, such as Treasury bonds, which could increase downside pressure on the Nasdaq 100 if no agreement is reached in the short term.
The Week of the Fed Has Arrived
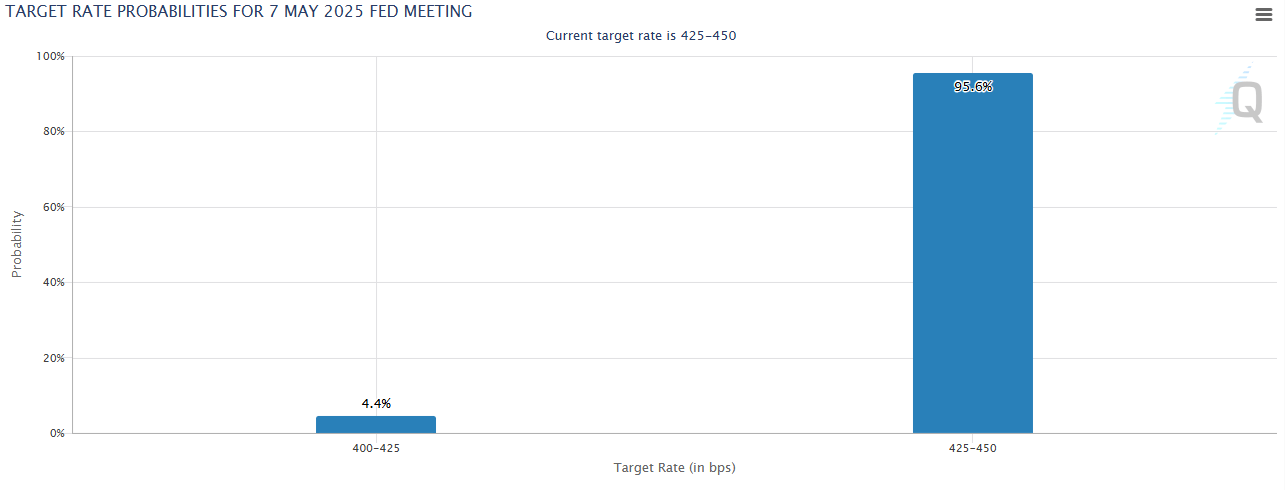
This week, the Federal Reserve's interest rate decision is scheduled for May 7. According to CME Group, there is a 95.6% probability that the rate will remain in the current 4.25%–4.5% range.
Source: CME Group
Although markets are closely watching for key signals from Jerome Powell, expectations for future rate cuts remain elevated. The current high rate has increased the cost of borrowing in the U.S. and has started to weigh on consumer spending, a key factor in corporate growth. If the central bank adopts a more hawkish stance and refrains from lowering rates in upcoming meetings, it is likely that confidence and the current bullish trend in the Nasdaq 100 may begin to weaken, amid concerns over a less favorable environment for domestic consumption.
Nasdaq 100 Technical Outlook

Source: StoneX, Tradingview
- Bullish Trend: Since early April, a solid uptrend has formed, highlighting the dominance of bullish momentum. However, the price has encountered resistance around the 20,000-point level, which is now the most relevant technical barrier. So far, there are no signs of bearish corrections that could threaten the existing upward structure on the chart.
- Momentum Weakens in Technical Indicators:
- MACD: Although the MACD histogram remains above the neutral zero line, it has started to flatten, which may indicate a phase of consolidation in the strength of the moving averages.
- RSI: The RSI line recently approached overbought territory (level 70), but has also begun to flatten, suggesting that buying momentum over the past 14 sessions is fading, which could lead to a pause in price movement.
Both indicators reinforce the perception of no clear short-term direction as the price tests the 20,000-point resistance.
Key Levels:
- MACD: Although the MACD histogram remains above the neutral zero line, it has started to flatten, which may indicate a phase of consolidation in the strength of the moving averages.
- 20,000 points – Main Resistance: This level aligns with the 200-period simple moving average, the Ichimoku cloud, and recent neutral zones. A breakout above this level could strengthen the bullish trend and extend buying pressure.
- 19,000 points – Nearby Support: This level coincides with the 50-period simple moving average and may serve as a short-term rebound zone in case of light corrections.
- 18,400 points – Final Support: This area lies below the current bullish trendline. A decline to this level could undermine the current bullish structure and potentially trigger a trend reversal.
Written by Julian Pineda, CFA – Market Analyst
Follow him at: @julianpineda25
Related tags:


Open an account in minutes
Experience award-winning platforms with fast and secure execution, and enjoy tight spreads from 0.5 pts on FX and 0.3 pts on indices.
Economic calendar
Web Trader platform
Our sophisticated web-based platform is packed with features.
Related articles

Gold Update: XAU/USD Remains Under Pressure Even After the NFP Report
As the trading week comes to an end, weakness around gold price action remains evident in the short term. This can be seen in the performance of the past two sessions, where the metal has declined by approximately 0.3%. Although the move has not been particularly aggressive, it highlights that buying pressure continues to struggle to regain control of the market.

Dow Jones Slide Shows What Rate Hike Bets Mean for Stocks
The Dow Jones support breakdown shows rising bond yields and rate hike bets hitting U.S. stocks while tech giants prop up the Nasdaq.


NFP Preview: Can the Jobs Report Overcome the Bond Market Meltdown Too?
Traders and economists expect the NFP report to show that the US created 90K net new jobs, with average hourly earnings rising 0.3% m/m (3.1% y/y) and the U3 unemployment rate at 4.1% - see what the leading indicators are suggesting!

This report is intended for general circulation only. It should not be construed as a recommendation, or an offer (or solicitation of an offer) to buy or sell any financial products. The information provided does not take into account your specific investment objectives, financial situation or particular needs. Before you act on any recommendation that may be contained in this report, independent advice ought to be sought from a financial adviser regarding the suitability of the investment product, taking into account your specific investment objectives, financial situation or particular needs.
StoneX Financial Pte. Ltd., may distribute reports produced by its respective foreign entities or affiliates within the StoneX group of companies or third parties pursuant to an arrangement under Regulation 32C of the Financial Advisers Regulations. Where the report is distributed to a person in Singapore who is not an accredited investor, expert investor or an institutional investor (as defined in the Securities Futures Act), StoneX Financial Pte. Ltd. accepts legal responsibility to such persons for the contents of the report only to the extent required by law. Singapore recipients should contact StoneX Financial Pte. Ltd. at 6826 9988 for matters arising from, or in connection with the report.
In the case of all other recipients of this report, to the extent permitted by applicable laws and regulations neither StoneX Financial Pte. Ltd. nor its associated companies will be responsible or liable for any loss or damage incurred arising out of, or in connection with, any use of the information contained in this report and all such liability is hereby expressly disclaimed. No representation or warranty is made, express or implied, that the content of this report is complete or accurate.
StoneX Financial Pte. Ltd. is not under any obligation to update this report.
Trading CFDs carries a high level of risk that may not be suitable for some investors. Consider your investment objectives, level of experience, financial resources, risk appetite and other relevant circumstances carefully. The possibility exists that you could lose some or all of your investments, including your initial deposits. If in doubt, please seek independent expert advice. Visit www.forex.com/en-sg/terms-and-policies for the complete Risk Disclosure Statement.