



NFP Preview: Is the AI “Jobpocalypse” at Hand?
NFP leading indicators point to a potentially above-expected reading in this month’s jobs report, with headline job growth coming in somewhere in the 120-160K range.
Share this:

>NFP Key Points
- NFP report expectations: +85K jobs, +0.3% m/m earnings, unemployment at 4.3%.
- NFP leading indicators point to a potentially above-expected reading in this month’s jobs report, with headline job growth coming in somewhere in the 120-160K range.
- The low volatility we’ve seen in recent weeks in the US Dollar Index (DXY) is unlikely to extend much longer.
When is the May NFP Report?
The May NFP report will be released on Friday, June 5, at 8:30 ET.
NFP Report Expectations
Traders and economists expect the NFP report to show that the US created 85K net new jobs, with average hourly earnings rising 0.3% m/m (3.4% y/y) and the U3 unemployment rate at 4.3%.
NFP Overview
Are we starting to see signs of the AI “Jobpocalypse”?
If we are, they’re extremely small so far.
High-profile layoffs at the likes of Meta (8K jobs), Cisco (4K jobs), and IBM (7.8K jobs) were attributed to AI efficiencies in recent months. These concerns have been compounded by the last few monthly reports from Challenger, Gray & Christmas. AI represented the leading cited reason for job cuts in each of the last three months, with 21.5K AI-related cuts in April and over 38K layoffs in this morning’s report (40%).
Despite these anecdotes, a broader slowdown remains elusive in macroeconomic data, with better-than-expected NFP reports in each of the last two months. By that measure, the US labor market has remained relatively resilient, adding an average of about 80K jobs per month so far this year, enough to keep the unemployment rate unchanged at the historically low level of 4.3%. Now the jobs market faces its latest test, the May NFP report, with traders expecting an extension of the “low hire, low fire” regime that has characterized the past year or so:

Source: StoneX
As the graphic above shows, traders are essentially anticipating another steady jobs report, with modest job growth, stable unemployment, and continued gradual wage increases.
Combined with accelerating inflation above the Federal Reserve’s 2% target amidst the ongoing closure of the Strait of Hormuz, traders are starting to price in the potential for an interest rate hike from the Federal Reserve this year, with the CME’s FedWatch tool showing about a 50% probability of at least one rate increase by December, despite the ostensibly-dovish Kevin Warsh taking over as the leader of the institution:
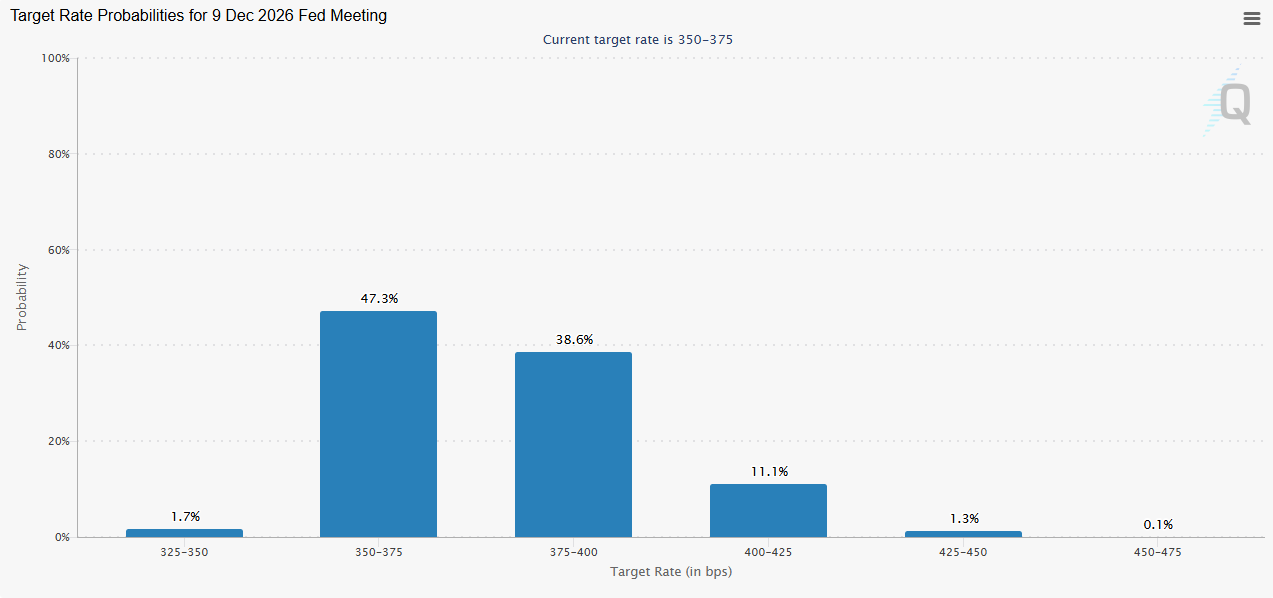
Source: CME FedWatch
NFP Forecast
As regular readers know, we focus on four historically reliable leading indicators to help handicap each NFP report:
- The ISM Manufacturing Employment subindex rose to 48.6 from 46.4 last month.
- The ISM Services Employment subindex held steady at 47.9 vs. 48.0 last month.
- The ADP Employment report came in at 122K jobs, up from last month’s 109K reading.
- The 4-week moving average of initial unemployment claims rose to 215K, up from 203K last month.
Weighing the data and our internal models, the leading indicators point to a potentially above-expected reading in this month’s jobs report, with headline job growth coming in somewhere in the 120-160K range, albeit with a big band of uncertainty given the limited response rates.
Regardless, the month-to-month fluctuations in this report are notoriously difficult to predict, so we wouldn’t put too much stock into any forecasts (including ours). As always, the other aspects of the release, including the closely watched average hourly earnings figure and unemployment rate will also impact how markets react to the release.
Potential NFP Market Reaction
|
|
Wages < 0.2% m/m |
Wages 0.2-0.4% m/m |
Wages > 0.4% m/m |
|
< 20K jobs |
Slightly Bearish USD |
Slightly Bearish USD |
Neutral USD |
|
20-110K jobs |
Neutral USD |
Neutral USD |
Slightly Bullish USD |
|
> 110K jobs |
Neutral USD |
Slightly Bullish USD |
Bullish USD |
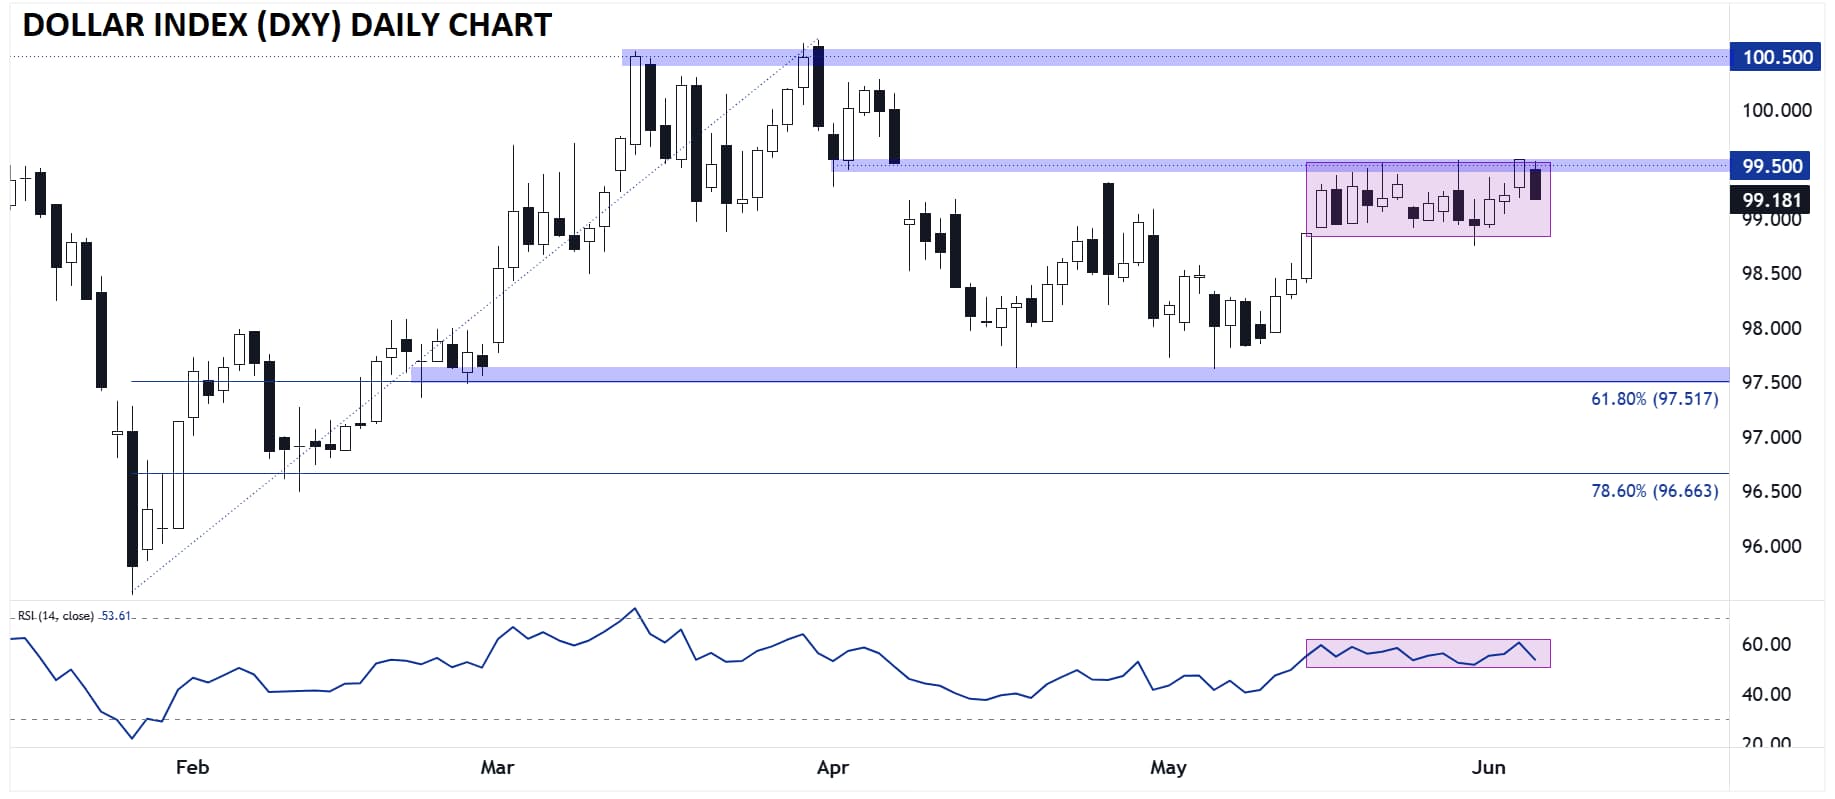
Technically speaking, the US dollar is trading near the top of its 2-month range against its major rivals, with the ongoing conflict in Iran as the primary driver. Further de-escalation could weigh on the greenback regardless of what this month’s jobs report shows.
US Dollar Index Technical Analysis – DXY Daily Chart
Source: TradingView, StoneX
As the chart above shows, the US Dollar Index (DXY) has spent the last couple weeks consolidating within a tight range, which is itself within a broader 3-month consolidation zone. The long period of low volatility reflects geopolitical uncertainty amidst the ongoing fragile ceasefire in the Middle East and mixed economic data, potentially setting the stage for a more volatile breakout in the coming days.
A bullish breakout above 99.50, driven by either a stronger-than-anticipated jobs report or re-escalation in Iran, would open the door for a continuation toward the Dollar Index’s 1-year high near 100.50 next, whereas a bearish breakdown could set the stage for a continuation down to the 3-month low closer to 97.50. One way or another, the low volatility we’ve seen in recent weeks is unlikely to extend much longer.
-- Written by Matt Weller, Global Head of Research
Follow Matt on Twitter: @MWellerFX
Latest market news




Open an account in minutes
Experience award-winning platforms with fast and secure execution, and enjoy tight spreads from 0.5 pts on FX and 0.3 pts on indices.
Economic calendar
Web Trader platform
Our sophisticated web-based platform is packed with features.
Related articles
Australian Dollar Forecast: AUD/USD Breaks Multi-Month Range, Hits 10-Month Low 11 14 2026
Aussie bears are closing in on major technical support, with next week's Australian employment data raising the stakes for a pivotal reaction.

USD/JPY Weekly Outlook: Bulls Eye Higher Range After Historic Rate Shock
A historic US rate shock has sent USD/JPY above 160, but with intervention risks rising and few major economic catalysts ahead, AI sentiment could hold the key to the next move.

US Dollar Price Action Setups: EUR/USD, USD/JPY
The US Dollar broke out to a fresh yearly high after the CPI report, and that Dollar strength was on full view in pretty much all major pairings with a particular push in EUR/USD.
This report is intended for general circulation only. It should not be construed as a recommendation, or an offer (or solicitation of an offer) to buy or sell any financial products. The information provided does not take into account your specific investment objectives, financial situation or particular needs. Before you act on any recommendation that may be contained in this report, independent advice ought to be sought from a financial adviser regarding the suitability of the investment product, taking into account your specific investment objectives, financial situation or particular needs.
StoneX Financial Pte. Ltd., may distribute reports produced by its respective foreign entities or affiliates within the StoneX group of companies or third parties pursuant to an arrangement under Regulation 32C of the Financial Advisers Regulations. Where the report is distributed to a person in Singapore who is not an accredited investor, expert investor or an institutional investor (as defined in the Securities Futures Act), StoneX Financial Pte. Ltd. accepts legal responsibility to such persons for the contents of the report only to the extent required by law. Singapore recipients should contact StoneX Financial Pte. Ltd. at 6826 9988 for matters arising from, or in connection with the report.
In the case of all other recipients of this report, to the extent permitted by applicable laws and regulations neither StoneX Financial Pte. Ltd. nor its associated companies will be responsible or liable for any loss or damage incurred arising out of, or in connection with, any use of the information contained in this report and all such liability is hereby expressly disclaimed. No representation or warranty is made, express or implied, that the content of this report is complete or accurate.
StoneX Financial Pte. Ltd. is not under any obligation to update this report.
Trading CFDs carries a high level of risk that may not be suitable for some investors. Consider your investment objectives, level of experience, financial resources, risk appetite and other relevant circumstances carefully. The possibility exists that you could lose some or all of your investments, including your initial deposits. If in doubt, please seek independent expert advice. Visit www.forex.com/en-sg/terms-and-policies for the complete Risk Disclosure Statement.