



S&P 500 Seasonality: How Santa's Rally Across Wall Street Stacks Up
Explore how the S&P 500, Nasdaq, Dow and Russell 2000 typically perform in December, and which sectors show the strongest seasonal edge during Santa’s rally.
Share this:

The bullish seasonality often seen in December — widely referred to as Santa’s rally — is well established. This report examines how the S&P 500 stacks up against other major Wall Street indices, analysing average returns, win rates and volatility. It also breaks down which sectors tend to outperform during December and where the strongest seasonal edge typically lies.
View related analysis:
View related analysis:
Seasonality in December for Global Indices
All available historical data from my LSEG Workspace platform has been used for each cash index.
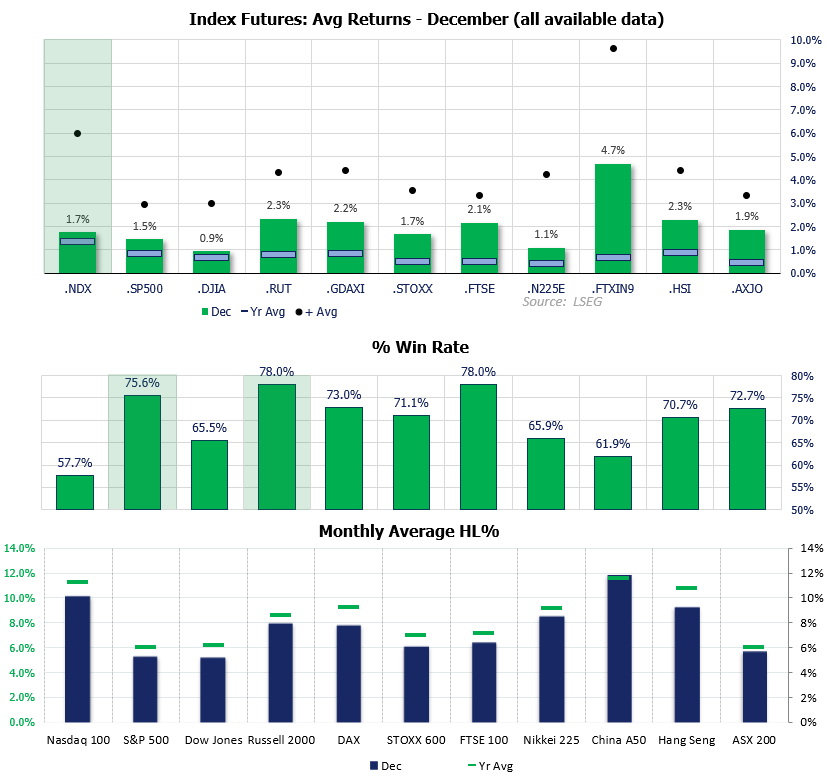
- The top panel displays the average percentage return for each market in December. It not only compares relative performance across indices, but also shows the 1-year and ‘average positive’ figures, highlighting how each market’s December return sits against its annual average and typical bullish December. This helps gauge expectations for whether we might see another strong month.
- The middle panel shows the percentage win rate — how often each index delivers a positive December. A reading above 50% indicates a bullish tendency; below 50% indicates the opposite.
- The lower panel displays the average volatility for December alongside each index’s average monthly volatility over the year. This reveals whether December tends to be more or less volatile than usual.
Charts prepared by Matt Simpson, Source: LSEG
Nasdaq 100 Leads Wall Street (on a good month)
The Nasdaq 100 tends to deliver the strongest returns among its Wall Street peers — the S&P 500 and Dow Jones — with an average December gain of 1.7%, above its annual average of 1.3%. However, it also has the lowest win rate at just 57.7%. Its average monthly range of 10% is also below its annual average range.
That said, when the Nasdaq does post a positive December, its average rally jumps to 6% — comfortably outperforming the S&P 500, Dow Jones, and even the Russell 2000.
This suggests the technology sector offers the best upside potential in a bullish December, but not the highest probability of delivering that outcome.
Russell 2000, S&P 500 have the highest win rates for Wall Street
While the Nasdaq’s upside potential is attractive, its relatively low win rate makes it less reliable. The S&P 500, by contrast, has a win rate of 75.6%, meaning its 3% ‘positive month average’ is statistically more consistent — even if its typical positive return of 1.5% trails the Nasdaq.
The Russell 2000 stands out even further, with a win rate of 78%, an average December return of 2.3%, and a positive-month average of 4.3%. This shows the Russell 2000 has historically outperformed the major Wall Street benchmarks in terms of consistency and average gains during December.


S&P 500 Futures – Average Daily Returns for December
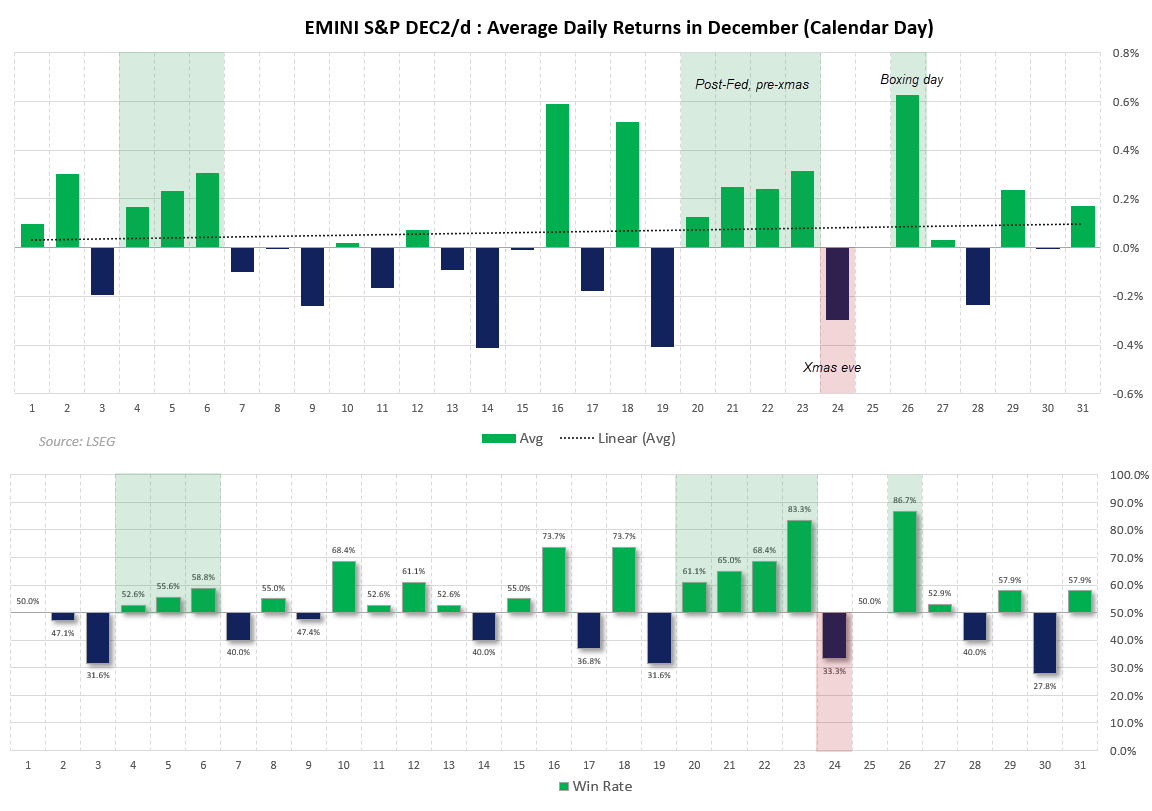
By examining the average daily returns of the S&P 500 futures contract throughout December, we can highlight recurring patterns within the month. One of the clearest is the four-day stretch from 20–23 December, where average returns are consistently positive and the win rate rises steadily.
Liquidity typically dries up in the days leading into Christmas following the final Fed meeting of the year. Whether this pattern reflects algorithmic buying or retail traders in a festive mood is unclear — but the tendency itself is unmistakable.
I generally prefer multi-day patterns, but the single bearish day with a negative win rate on Christmas Eve is likely explained by traders squaring up positions ahead of the holiday. Also note the unusually strong win rate and average return on Boxing Day, though traders should treat these thin-market conditions with caution.
Outside of the pre-Christmas window, average returns are also positive with an associated uptick in win rate between 4–6 December.
Charts prepared by Matt Simpson, Source: LSEG
S&P 500 Sector Performance in December: Best and Worst Seasonal Trends
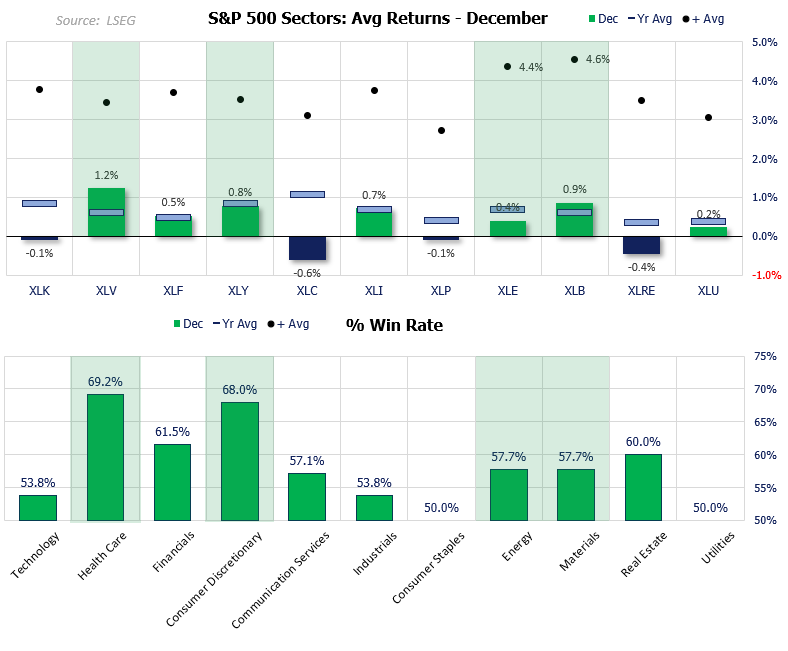
- Healthcare has the strongest overall December performance, with an average return of 1.2% and a sector-leading win rate of 69.2%.
- Materials delivers the strongest ‘positive-month’ average return at 4.6%, although its win rate is a more modest 57.7%.
- Consumer Discretionary shows reliable seasonal strength, posting a win rate of 68% and an average return of 0.8%, consistent with a classic year-end risk-on pattern.
- Technology has historically been closer to a coin flip, with a slightly negative average return of -0.1% and a win rate of 53.8%. That said, its average gain during bullish Decembers is a solid 3.8%.
- Communication Services has the weakest average December return at -0.6%, but a win rate of 57.1% suggests a few heavy losing years are skewing the mean lower.
- Real Estate is the other sector with negative average returns, yet it still posts a positive win rate of 60%. This indicates the sector is less likely to deliver strong gains rather than being a clear short candidate — unless the broader market is falling.
Charts prepared by Matt Simpson, Source: LSEG


Final Thoughts
- December seasonality remains a genuine feature across global equity markets, but the strength and reliability of the so-called Santa rally vary widely by index.
- Wall Street’s best upside potential still lies with the Nasdaq 100, but the highest consistency comes from the Russell 2000 and S&P 500, which show superior win rates.
- Intramonth patterns reinforce this, with S&P 500 futures showing a clear positive stretch from 20–23 December, a weak patch on Christmas Eve, and an unusually strong Boxing Day performance — though traders should be cautious in thin holiday liquidity.
- Sector seasonality adds another layer: Healthcare and Consumer Discretionary carry the strongest historical profiles, while Communication Services and Real Estate tend to underperform on average despite positive win rates.
- Taken together, December favours a selective, data-aware approach: lean into indices and sectors with both upside and reliable seasonality, but avoid assuming a rally will materialise without confirmation from price action and liquidity conditions.
View the full economic calendar
View the full economic calendar
-- Written by Matt Simpson
Follow Matt on Twitter @cLeverEdge
How to trade with City Index
You can trade with City Index by following these four easy steps:
- Open an account, or log in if you’re already a customer
• Open an account in the UK
• Open an account in Australia
• Open an account in Singapore
- Search for the market you want to trade in our award-winning platform
- Choose your position and size, and your stop and limit levels
- Place the trade
Related tags:
Latest market news




Open an account in minutes
Experience award-winning platforms with fast and secure execution, and enjoy tight spreads from 0.5 pts on FX and 0.3 pts on indices.
Economic calendar
Web Trader platform
Our sophisticated web-based platform is packed with features.
Related articles
S&P 500, Nasdaq, Dow Forecast: Nasdaq Selloff Deepens as Dow Rally Stalls 10 24 2026
A failed S&P breakout and looming Nasdaq support test raise the stakes for next week’s Fed decision and October’s monthly close.


Nasdaq 100 Forecast: NDX Falls as the tech rout continues and oil prices soar
U.S. stocks are pointing to a modestly lower open after a sharp AI sell-off yesterday, as telecom stocks slide. Brent rises towards $115 adding to inflation pressures ahead of the FOMC rate decision.


S&P 500 forecast: AI linked stocks remain under pressure
And just like that, it is Friday again and the end of a volatile week. Today offers little on the macro calendar to change the prevailing narrative, leaving markets largely at the mercy of risk appetite, oil prices and the growing unease around the AI trade.
This report is intended for general circulation only. It should not be construed as a recommendation, or an offer (or solicitation of an offer) to buy or sell any financial products. The information provided does not take into account your specific investment objectives, financial situation or particular needs. Before you act on any recommendation that may be contained in this report, independent advice ought to be sought from a financial adviser regarding the suitability of the investment product, taking into account your specific investment objectives, financial situation or particular needs.
StoneX Financial Pte. Ltd., may distribute reports produced by its respective foreign entities or affiliates within the StoneX group of companies or third parties pursuant to an arrangement under Regulation 32C of the Financial Advisers Regulations. Where the report is distributed to a person in Singapore who is not an accredited investor, expert investor or an institutional investor (as defined in the Securities Futures Act), StoneX Financial Pte. Ltd. accepts legal responsibility to such persons for the contents of the report only to the extent required by law. Singapore recipients should contact StoneX Financial Pte. Ltd. at 6826 9988 for matters arising from, or in connection with the report.
In the case of all other recipients of this report, to the extent permitted by applicable laws and regulations neither StoneX Financial Pte. Ltd. nor its associated companies will be responsible or liable for any loss or damage incurred arising out of, or in connection with, any use of the information contained in this report and all such liability is hereby expressly disclaimed. No representation or warranty is made, express or implied, that the content of this report is complete or accurate.
StoneX Financial Pte. Ltd. is not under any obligation to update this report.
Trading CFDs carries a high level of risk that may not be suitable for some investors. Consider your investment objectives, level of experience, financial resources, risk appetite and other relevant circumstances carefully. The possibility exists that you could lose some or all of your investments, including your initial deposits. If in doubt, please seek independent expert advice. Visit www.forex.com/en-sg/terms-and-policies for the complete Risk Disclosure Statement.