



S&P 500 Rally: What Taylor Swift’s Eras Tour Teaches Investors About Extreme Stock Market Demand
Taylor Swift’s Eras Tour showed how extreme demand can feed on itself. The S&P 500’s 18% rally in nine weeks may carry a similar message: history suggests strong momentum has often led to further gains, though pullback risk remains.
Share this:

S&P 500 Key Points
- Taylor Swift’s Eras Tour showed how extreme demand can become self-reinforcing; markets can display a similar momentum effect.
- Since 1950, there have been only 10 prior non-overlapping instances of the S&P 500 rallying at least 18% in nine weeks, with the index rising 90% of the time over the following 4, 13, 26, and 52 weeks.
- The signal is not risk-free: the median 52-week maximum drawdown was nearly 8%, and 4 of the 10 prior cases saw a 10%+ pullback within the following year.
Singer-Songwriter Taylor Swift kicked off her “Eras” Concert Tour on March 17, 2023, to enormous fanfare:
- While face-value tickets ranged from $49-$449, early resale listings reached as high as $22,700.
- Ticketmaster was hit with 3.5 billion system requests, 4X its previous peak, selling 2.4 million tickets in a single day.
- The tour brought a dramatic economic boon to cities (“Swiftonomics”), with Barclays projecting that the UK leg of the tour alone boosted the UK economy by $1.2B.
- By the end of the tour’s 149-show run in December 2024, the tour had grossed more than $2 billion in ticket sales across 10 million tickets sold.
Demand for the Eras Tour was, by any measure, extreme.
Why am I talking about the Eras Tour?
Besides the fact that I have a Swiftie daughter, the Eras Tour underscores a point that many traders forget: Extreme demand can be self-reinforcing. Diehard fans set alarms to buy tickets the second they became available, resale prices surged, social media amplified the frenzy, and more casual fans were pulled in by the sense that this was a once-in-a-generation cultural event.
This “momentum” effect exists in markets as well.
On Twitter yesterday, my colleague John Kicklighter highlighted another market undergoing extreme demand: The S&P 500.
For perspective, this 9-week charge in risk appetite (using SPX for that here) has been exceptional/extreme.
— John Kicklighter (@JohnKicklighter) May 28, 2026
Last time we had a charge of this magnitude was 6 years ago in the recovery from the pandemic selloff.
Only six other rallies of this intensity in the past 50 years pic.twitter.com/Rdp2BJLeUp
Source: Twitter
Some traders instinctively view this type of surge as a sign of a “stretched” or “overbought” market, but the historical record suggests that, as with Taylor Swift’s Eras Tour, the recent extreme demand for the S&P 500 is better viewed as a bullish intermediate-term signal than an automatic warning sign.
Using a slightly broader +18% threshold and non-overlapping weekly signals, there have been only 10 prior instances of the S&P 500 seeing a +18% rally over a 9-week (~2-month) period, and forward (price-only) returns have been generally strong:
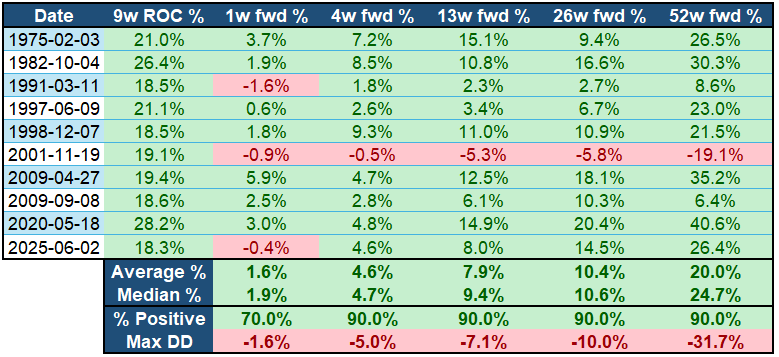
Source: TradingView, StoneX. The latest available S&P 500 close was used as a proxy for the still-incomplete 52-week return from the 6/2/2025 signal. Past performance is not indicative of future returns.
Looking beyond just next week, the S&P 500 has historically risen 90% of the time over the next 4, 13, 26, and 52 weeks following a +18% rally in nine weeks, with average returns of +4.6% over the next month, +7.9% over the next quarter, and +20% over the next year.
That said, these gains were not automatic, and the 2001 instance shows the potential downside risk. In that case, the market peaked almost immediately after its 9-week surge, falling -5.3% over the next quarter and -19.1% over the following year, including a harrowing -31.7% maximum drawdown along the way. Across the full sample, the median 52-week maximum drawdown was still nearly -8%, and 4 of the 10 cases saw a 10%+ drawdown at some point over the following year.
There are no guarantees in markets, especially with a sample of just 10 historical episodes, but the broader takeaway is clear: when demand for stocks has been this extreme, it has historically been more consistent with an extended uptrend than imminent exhaustion.
Like the Eras Tour, the S&P 500’s recent surge may look crowded and overextended. But sometimes extreme demand does not mark the end of the move. Sometimes, it is the reason the move keeps going.
The market may be extended, but history suggests extended and exhausted are not the same thing.


-- Written by Matt Weller, Global Head of Research
Check out Matt’s Daily Market Update videos on YouTube and be sure to follow Matt on Twitter: @MWellerFX
Related tags:



Open an account in minutes
Experience award-winning platforms with fast and secure execution, and enjoy tight spreads from 0.5 pts on FX and 0.3 pts on indices.
Economic calendar
Web Trader platform
Our sophisticated web-based platform is packed with features.
Related articles

USD/JPY weekly outlook: Quarter turn scrambles rates regime
USD/JPY’s tight relationship with front-end US rates broke down sharply last week, but quarter-turn flows and positioning suggest the disconnect may prove temporary.


Dow Jones Slide Shows What Rate Hike Bets Mean for Stocks
The Dow Jones support breakdown shows rising bond yields and rate hike bets hitting U.S. stocks while tech giants prop up the Nasdaq.


What Stretched 10-Year Yields Mean for Major Currency Pairs in Q4
U.S. 10-year Treasury yields are nearing a long-term resistance zone with overbought RSI readings, raising near-term pullback risk for the dollar.

This report is intended for general circulation only. It should not be construed as a recommendation, or an offer (or solicitation of an offer) to buy or sell any financial products. The information provided does not take into account your specific investment objectives, financial situation or particular needs. Before you act on any recommendation that may be contained in this report, independent advice ought to be sought from a financial adviser regarding the suitability of the investment product, taking into account your specific investment objectives, financial situation or particular needs.
StoneX Financial Pte. Ltd., may distribute reports produced by its respective foreign entities or affiliates within the StoneX group of companies or third parties pursuant to an arrangement under Regulation 32C of the Financial Advisers Regulations. Where the report is distributed to a person in Singapore who is not an accredited investor, expert investor or an institutional investor (as defined in the Securities Futures Act), StoneX Financial Pte. Ltd. accepts legal responsibility to such persons for the contents of the report only to the extent required by law. Singapore recipients should contact StoneX Financial Pte. Ltd. at 6826 9988 for matters arising from, or in connection with the report.
In the case of all other recipients of this report, to the extent permitted by applicable laws and regulations neither StoneX Financial Pte. Ltd. nor its associated companies will be responsible or liable for any loss or damage incurred arising out of, or in connection with, any use of the information contained in this report and all such liability is hereby expressly disclaimed. No representation or warranty is made, express or implied, that the content of this report is complete or accurate.
StoneX Financial Pte. Ltd. is not under any obligation to update this report.
Trading CFDs carries a high level of risk that may not be suitable for some investors. Consider your investment objectives, level of experience, financial resources, risk appetite and other relevant circumstances carefully. The possibility exists that you could lose some or all of your investments, including your initial deposits. If in doubt, please seek independent expert advice. Visit www.forex.com/en-sg/terms-and-policies for the complete Risk Disclosure Statement.