


Silver crash: is 2026 repeating the 2011 collapse, or is this time different?
Silver has collapsed some 65% from its January peak, drawing uncomfortable comparisons with the 2011 crash. The parallels are striking, but a bigger bubble, a hawkish Federal Reserve and years of supply deficits make this episode different.
Share this:
Silver has fallen 20% in the space of just two weeks. From its January peak, it’s now down a staggering 65%. Many support levels have given way, triggering fresh selling momentum. Silver’s latest rout has drawn uncomfortable comparisons with the spectacular collapse of 2011. The similarities are difficult to ignore: both episodes followed extraordinary speculative rallies, both were amplified by leveraged positioning, and both unravelled as monetary conditions turned less favourable. But there are important differences in the scale of the preceding rallies, the speed of the declines and, crucially, the underlying fundamentals.
- Silver has fallen around 65% from its January 2026 peak of $121.65 to trade near $42 an ounce.
- As in 2011, a leveraged speculative rally has unravelled as the Federal Reserve turns less accommodating and the dollar firms.
- Unlike 2011, the 2026 collapse comes despite years of structural supply deficits in the silver market.
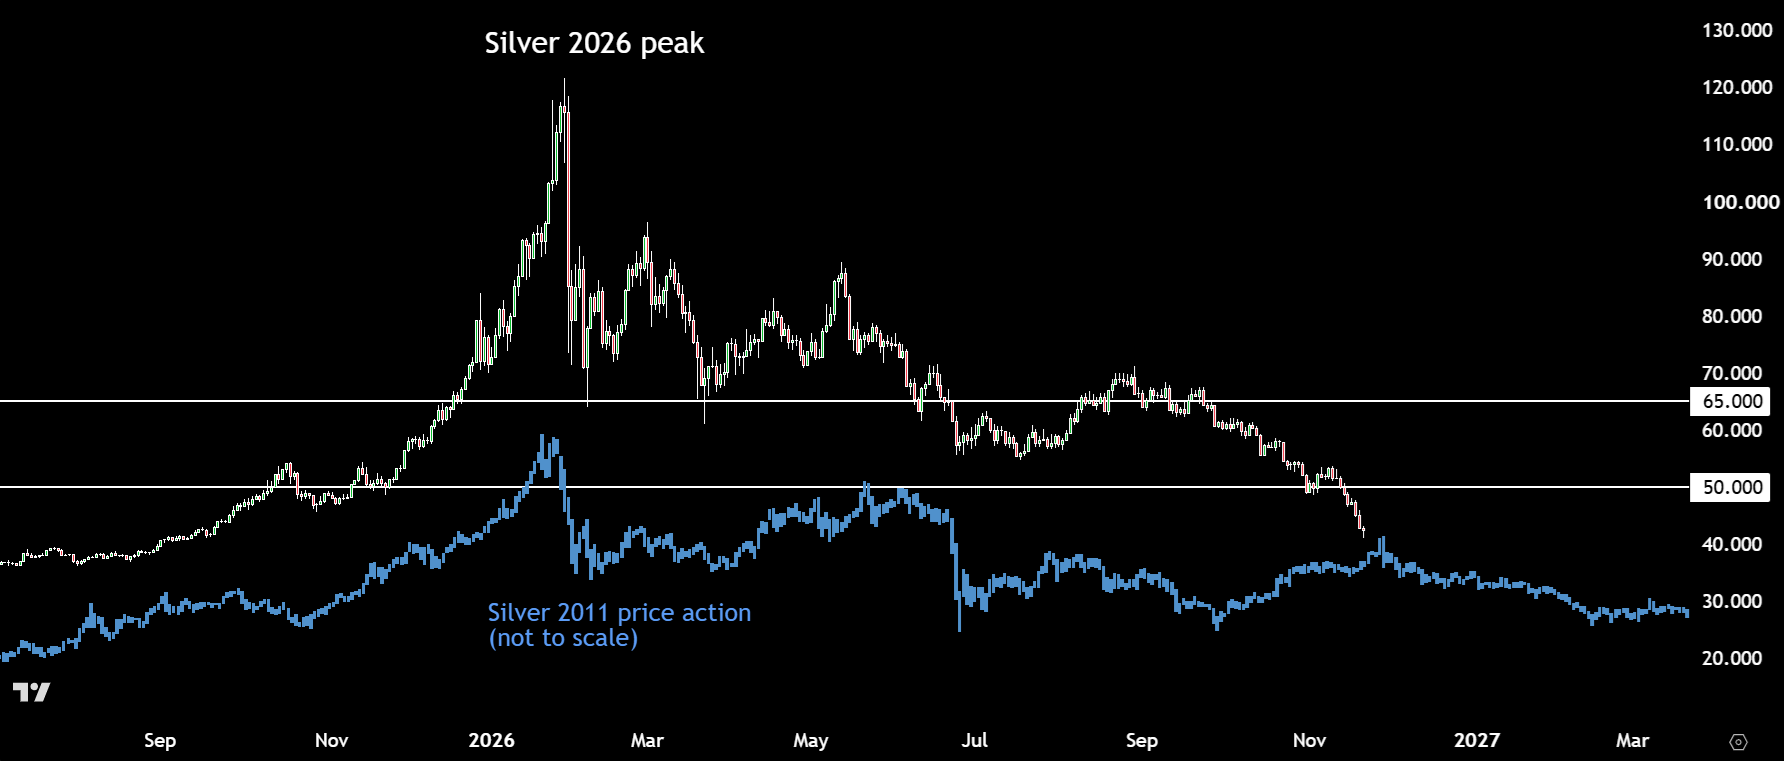
Spot silver is now trading around $42 an ounce, having fallen some 65% from its January 2026 peak of $121.65. That is an extraordinary reversal for a market which, only months ago, appeared to be in the grip of an almost unstoppable bull run.
The question now is whether this is simply a violent correction within a longer-term structural bull market, or the beginning of a much more prolonged bear market, similar to the one that followed silver’s 2011 peak.
2011: a speculative bubble meets tighter financial conditions
Silver’s 2011 collapse remains one of the clearest examples of how quickly speculative excess can unwind in a relatively small and illiquid market.
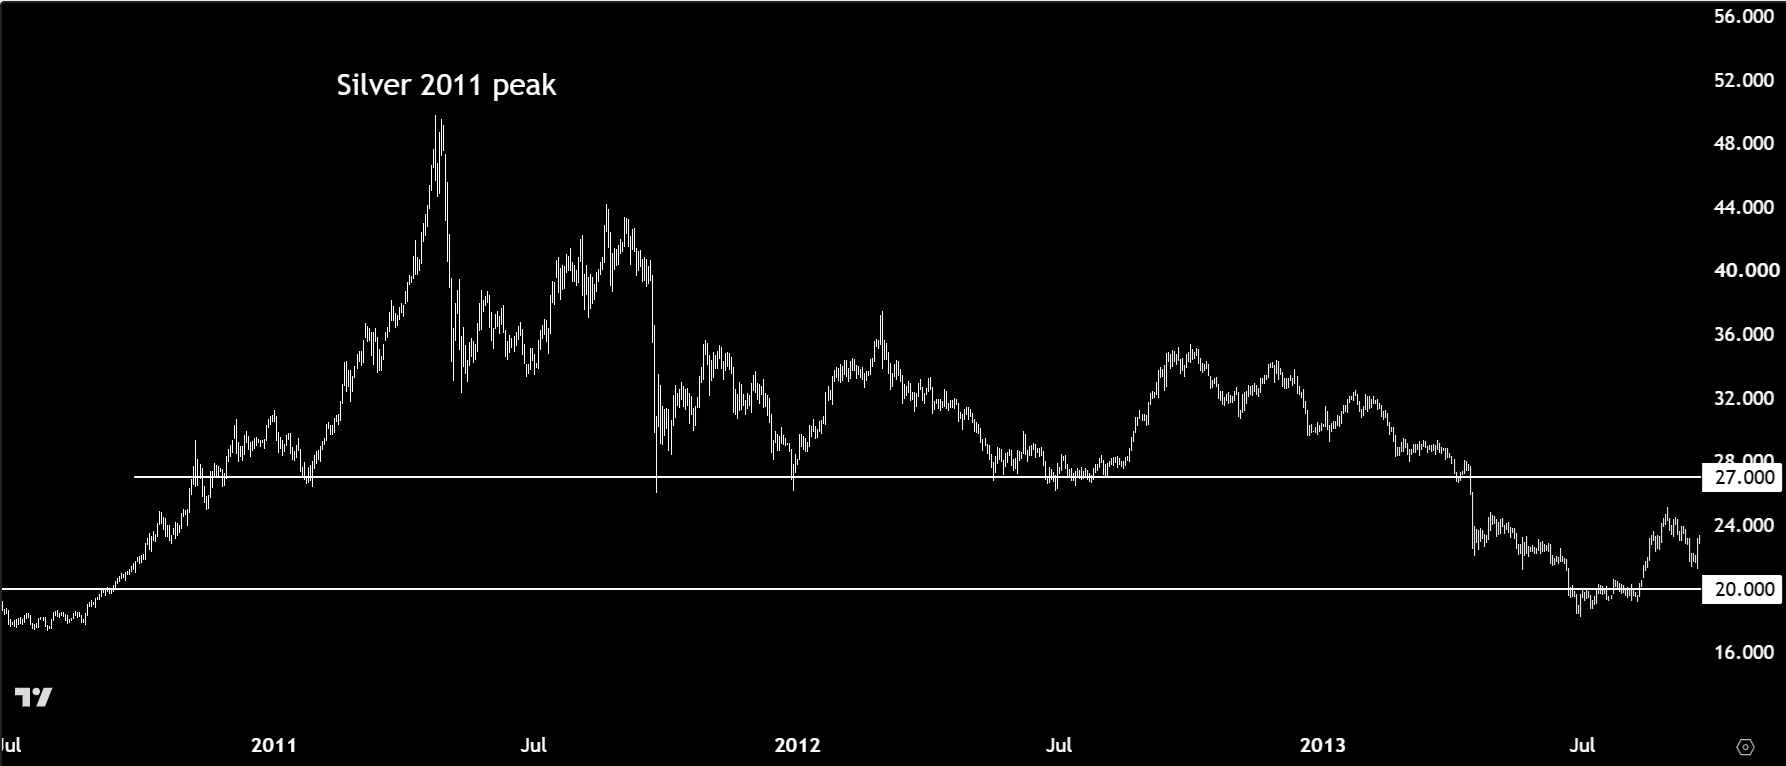
Having rallied aggressively on the back of a weak US dollar, quantitative easing and strong investment demand, silver approached $50 an ounce in late April 2011. The metal was trading close to its previous nominal record, established during the Hunt Brothers’ attempt to corner the market in 1980. Momentum had become increasingly detached from underlying fundamentals, with speculative buying playing an important role in pushing prices higher.
The reversal was brutal.
What caused the 2011 silver crash?
One of the immediate catalysts was a series of margin increases by the CME Group. In the space of roughly two weeks, futures margin requirements were raised five times, increasing the cost of maintaining leveraged positions by approximately 84%.
For investors who had borrowed heavily to gain exposure to silver, the changes were particularly damaging. Higher margin requirements meant that additional capital had to be committed to existing positions. Those unable or unwilling to meet the demands were forced to liquidate, adding further selling pressure to an already deteriorating market.
The timing was also significant. The Federal Reserve’s QE2 programme was approaching its conclusion, encouraging investors to reassess expectations for monetary conditions. A firmer dollar, profit-taking and reports of large funds reducing their exposure compounded the pressure.
Silver lost more than 30% in a matter of days and weeks, falling into the low-to-mid $30s during May 2011. But that was only the beginning. The metal continued to struggle over subsequent years, eventually falling into the mid-teens by 2015, before briefly trading around $11–12 during the pandemic-driven liquidation in March 2020.
In other words, the initial collapse developed into a prolonged bear market, with the eventual peak-to-trough decline reaching approximately 75–77%.
Silver’s 2026 collapse: a much bigger bubble, with a different monetary backdrop
The 2026 episode has followed a similar script, although the scale of the preceding rally has been considerably larger.
Silver broke decisively above its previous nominal highs in late 2025 before accelerating towards approximately $121.65 an ounce in January 2026. The move was fuelled by investment demand, bullish expectations surrounding industrial consumption, concerns about physical supply and a powerful momentum-driven speculative bid.
However, the market eventually reached a point where the bullish narrative could no longer justify the prices being paid.
The turning point has been a deterioration in the monetary backdrop. Rather than anticipating further easing, investors have increasingly had to contend with the prospect of additional Federal Reserve tightening. A December rate increase has become heavily priced into markets, while US Treasury yields have stayed around 5% at the 10-year maturity.
That combination has been particularly unfavourable for precious metals. Higher real yields increase the opportunity cost of holding assets that generate no income, while a stronger dollar makes dollar-denominated commodities more expensive for overseas buyers.
The resulting liquidation has been compounded by the unwinding of leveraged speculative positions and changes to futures margin requirements.
But there is another important dimension to the 2026 collapse: the damage caused by silver’s own extraordinary price appreciation.
At prices approaching $120, industrial users had a powerful incentive to reduce consumption, substitute alternative materials where possible and reconsider procurement strategies. The solar industry, one of silver’s most important sources of industrial demand, has increasingly focused on reducing the amount of silver used in photovoltaic cells. Jewellery and silverware demand have also come under pressure.
Meanwhile, weaker investment appetite and ETF outflows have released additional metal into the market, helping to ease physical tightness.
This is important because, unlike the 2011 episode, the latest collapse has unfolded against a backdrop of several consecutive years of structural supply deficits. The silver market is still projected to record a deficit of approximately 35 million ounces in 2026, with cumulative deficits since 2021 estimated at around 746 million ounces.
That provides a more supportive fundamental backdrop than existed during the previous speculative peak. However, it does not necessarily mean prices cannot fall considerably further. A structural deficit is not an immediate price floor, particularly when above-ground inventories and investment-related metal releases can help bridge the gap.
The similarities are striking, but there are important differences in 2011 vs 2026
There are several parallels between the two episodes. In both cases, silver experienced an extraordinary, almost vertical rally before speculative enthusiasm gave way to aggressive liquidation. Leverage magnified the initial moves, while a less accommodating monetary environment and a stronger US dollar helped undermine investor appetite.
The metal’s dual identity also matters. Silver is both a monetary asset and an industrial commodity, and its relatively small market makes it particularly vulnerable to sharp swings in investment flows. This helps explain why it has suffered more severe percentage declines than gold during periods of precious metals liquidation.
However, the differences should not be overlooked.
For starters, the 2026 rally was on an entirely different scale. In 2011, silver approached the $50 threshold. This time, it more than doubled that level, reaching $121.65. The subsequent decline has also been much larger in percentage terms over a relatively short period. From its January peak, silver has already lost more than 65% in ten and a half months.
The monetary backdrop is different, too. In 2011, markets were adjusting to the end of extraordinary post-financial-crisis stimulus. In 2026, the problem is persistent inflation and the prospect of an active rate-hiking cycle. That could mean a more sustained headwind for precious metals if yields and the dollar continue rising.
Perhaps the most important distinction, however, is the underlying physical market. The 2026 collapse is taking place despite years of cumulative supply deficits and continuing industrial demand. That does not eliminate the possibility of a prolonged bear market, but it does provide a fundamental argument for why the eventual recovery could be different from the one following 2011.
Watch: The Dollar is crushing metals
What happens next for silver?
At around $42, silver has now fallen back some $8 below the nominal highs established in 1980 and revisited in 2011. A level that once appeared almost impossible to breach has become resistance territory again, a striking reminder of how dramatically market psychology can change.
The immediate outlook remains challenging. Unless US yields begin to retreat sharply and the dollar loses momentum, there is little obvious macroeconomic incentive for investors to rush back into precious metals. Further forced liquidation cannot be ruled out either, with equity markets also coming under intense pressure.
However, it would be premature to conclude that silver must repeat the multi-year decline that followed 2011. The industrial demand base is more significant today, and the accumulated supply deficits offer a degree of fundamental support, even if elevated prices have encouraged substitution and demand destruction.
Ultimately, the distinction between a temporary liquidation and the beginning of a much longer bear market will depend on whether investment demand stabilises before industrial consumption weakens further.
The 2011 experience shows just how long silver can remain under pressure once a speculative bubble bursts. The 2026 episode has already delivered an even more dramatic reversal in percentage terms over a much shorter period. Whether the market has now removed enough excess speculation, or whether there is still another leg lower to come, will depend heavily on the direction of the dollar, Treasury yields and Federal Reserve policy.
If you are bullish on silver, it is best to wait for a clean reversal to suggest that at least a temporary low is in place.
So, let’s take a look at the current silver chart and provide a few levels to watch.
Silver technical analysis
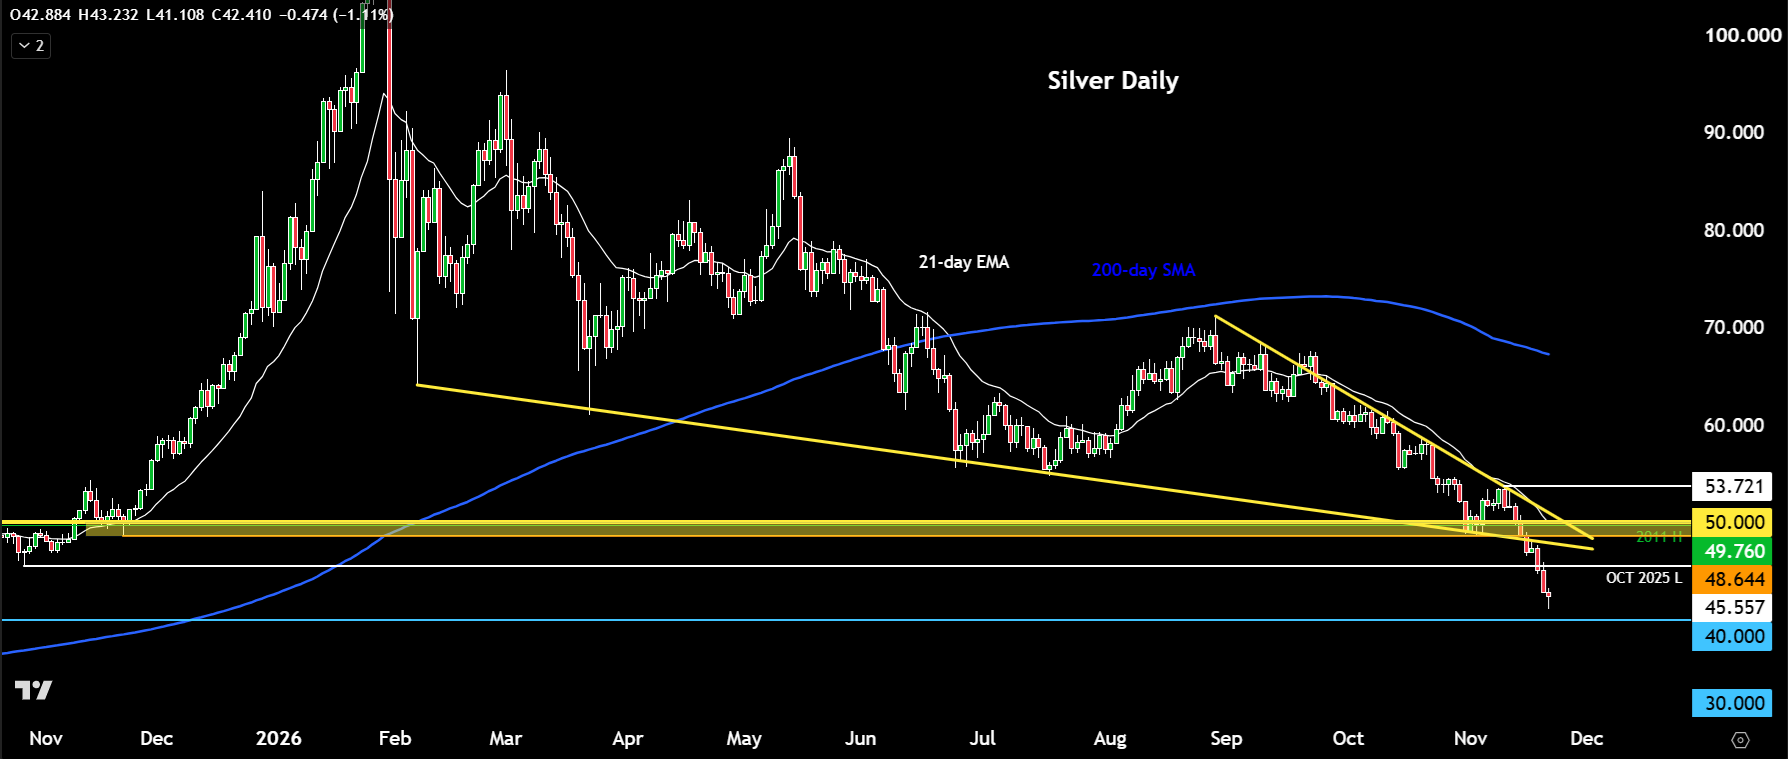
Silver is now heading for a third consecutive session of sharp losses, having fallen dramatically from last Tuesday’s high of $53.72. Since then, prices have declined by around 20%, extending the losses from the January peak to more than 65% at their lowest point today.
Clearly, the silver price chart is looking extremely oversold from a technical perspective. That does not necessarily mean a low is imminent, however. We don’t need the RSI indicator to tell us that selling has become excessive, which is why I have deliberately left it off the chart.
The next major level to watch is $40, which represents an important psychological threshold. Whether silver reaches that level or manages to find support there remains to be seen, but it is certainly worth keeping an eye on.
On the upside, the key level that needs to be reclaimed to give the market any realistic chance of staging a recovery is the October 2025 low at $45.55. This was the last significant trough before silver’s subsequent breakout, and reclaiming it would be an important first step towards stabilising the technical picture.
Should that happen, silver could have a reasonable chance of mounting a recovery, potentially towards $50. This is another major psychological level, having acted as both support and resistance in the past, not just in recent months but historically as well.
A move back above $50 in the coming days or weeks would be a strong bullish signal. It would suggest that this week’s sharp sell-off was little more than a bear trap, rather than the beginning of a more prolonged downturn.
For now, though, there is little evidence of a convincing bullish reversal. Traders should therefore remain nimble and patient, waiting for price action to provide the confirmation that many will undoubtedly be looking for before attempting to call a bottom.
Frequently Asked Questions
Why is silver falling so sharply in 2026?
Silver is falling because the monetary backdrop has turned against precious metals, with a December Federal Reserve rate increase heavily priced in and 10-year US Treasury yields around 5%. Higher real yields and a stronger dollar have triggered liquidation, compounded by the unwinding of leveraged positions, futures margin changes, ETF outflows and demand destruction after prices approached $120.
Does silver’s supply deficit put a floor under prices?
Not immediately. The silver market is still projected to run a deficit of around 35 million ounces in 2026, with cumulative deficits since 2021 of roughly 746 million ounces, but above-ground inventories and investment-related metal releases can bridge that gap for some time. The deficit offers fundamental support for an eventual recovery rather than a price floor.
What would signal that silver has found a bottom?
The first step would be silver reclaiming the October 2025 low at $45.55, the last significant trough before its breakout. A move back above $50 would be a strong bullish signal, suggesting the latest sell-off was a bear trap, while $40 is the next major psychological level on the downside.
-- Written by Fawad Razaqzada, Market Analyst | Follow Fawad on Twitter @Trader_F_R
Related tags:


Open an account in minutes
Experience award-winning platforms with fast and secure execution, and enjoy tight spreads from 0.5 pts on FX and 0.3 pts on indices.
Economic calendar
Web Trader platform
Our sophisticated web-based platform is packed with features.
Related articles
silver-crash-2026-vs-2011-collapse
Silver has collapsed some 65% from its January peak, drawing uncomfortable comparisons with the 2011 crash. The parallels are striking, but a bigger bubble, a hawkish Federal Reserve and years of supply deficits make this episode different.

Nasdaq 100, SOX: Tech rout may be a symptom of something far larger
The financial tide is going out, and some of the market's biggest winners are being hammered. Our research suggests there's more to the tech rout than the AI headlines.


Gold and Silver's Deepening Dollar Dilemma
The dollar has broken higher, gold and silver have been crushed, and US financial conditions are tightening rapidly. Our historical analysis suggests this is no ordinary precious metals selloff.
This report is intended for general circulation only. It should not be construed as a recommendation, or an offer (or solicitation of an offer) to buy or sell any financial products. The information provided does not take into account your specific investment objectives, financial situation or particular needs. Before you act on any recommendation that may be contained in this report, independent advice ought to be sought from a financial adviser regarding the suitability of the investment product, taking into account your specific investment objectives, financial situation or particular needs.
StoneX Financial Pte. Ltd., may distribute reports produced by its respective foreign entities or affiliates within the StoneX group of companies or third parties pursuant to an arrangement under Regulation 32C of the Financial Advisers Regulations. Where the report is distributed to a person in Singapore who is not an accredited investor, expert investor or an institutional investor (as defined in the Securities Futures Act), StoneX Financial Pte. Ltd. accepts legal responsibility to such persons for the contents of the report only to the extent required by law. Singapore recipients should contact StoneX Financial Pte. Ltd. at 6826 9988 for matters arising from, or in connection with the report.
In the case of all other recipients of this report, to the extent permitted by applicable laws and regulations neither StoneX Financial Pte. Ltd. nor its associated companies will be responsible or liable for any loss or damage incurred arising out of, or in connection with, any use of the information contained in this report and all such liability is hereby expressly disclaimed. No representation or warranty is made, express or implied, that the content of this report is complete or accurate.
StoneX Financial Pte. Ltd. is not under any obligation to update this report.
Trading CFDs carries a high level of risk that may not be suitable for some investors. Consider your investment objectives, level of experience, financial resources, risk appetite and other relevant circumstances carefully. The possibility exists that you could lose some or all of your investments, including your initial deposits. If in doubt, please seek independent expert advice. Visit www.forex.com/en-sg/terms-and-policies for the complete Risk Disclosure Statement.