


Top 5 Charts for This Week: Yields, Oil and USD/JPY
It’s a big week ahead with a widely expected FOMC rate hike followed by a Bank of Japan rate decision. But perhaps more pressing are moves showing in US Treasuries and Oil and what that might entail for the macro landscape.
Share this:

Talking Points:
- FOMC and BoJ rate decisions highlight this week’s calendar with both banks expected to hike rates.
- Those moves are largely priced-in so perhaps more important is what they say about future conditions.
- And maybe even more important than that are moves that have already shown in US Treasuries and Oil, which could have massive connotations on inflation which is driving (and leading) the actions from both of those banks.
This content was created by an affiliate of FOREX.com and represents the views and opinions of the author/speakers, not the views and opinions of Forex.com, StoneX Group Inc., or its subsidiaries. The content has not been independently reviewed by FOREX.com.
In this week’s Five Charts for the Week Ahead, the move in Treasury yields is the headline as the 10-year note is on the verge of a very important test. For the past 19 years there’s been but one single instance on the morning of October 23rd, 2023 in which the benchmark UST yielded 5%.
That ended up being a pretty epic buying opportunity as ZN rallied, and that was followed by US Treasury Secretary at the time, Janet Yellen, shifting upcoming Treasury issuance via the Quarterly Refunding Announcement, and that just further extended the move. The 10-year note futures contract rallied by 7.64% over the next couple of months, with 10-year yields dipping down to 3.8%.
10-Year Treasury Note Futures (ZN) Weekly Chart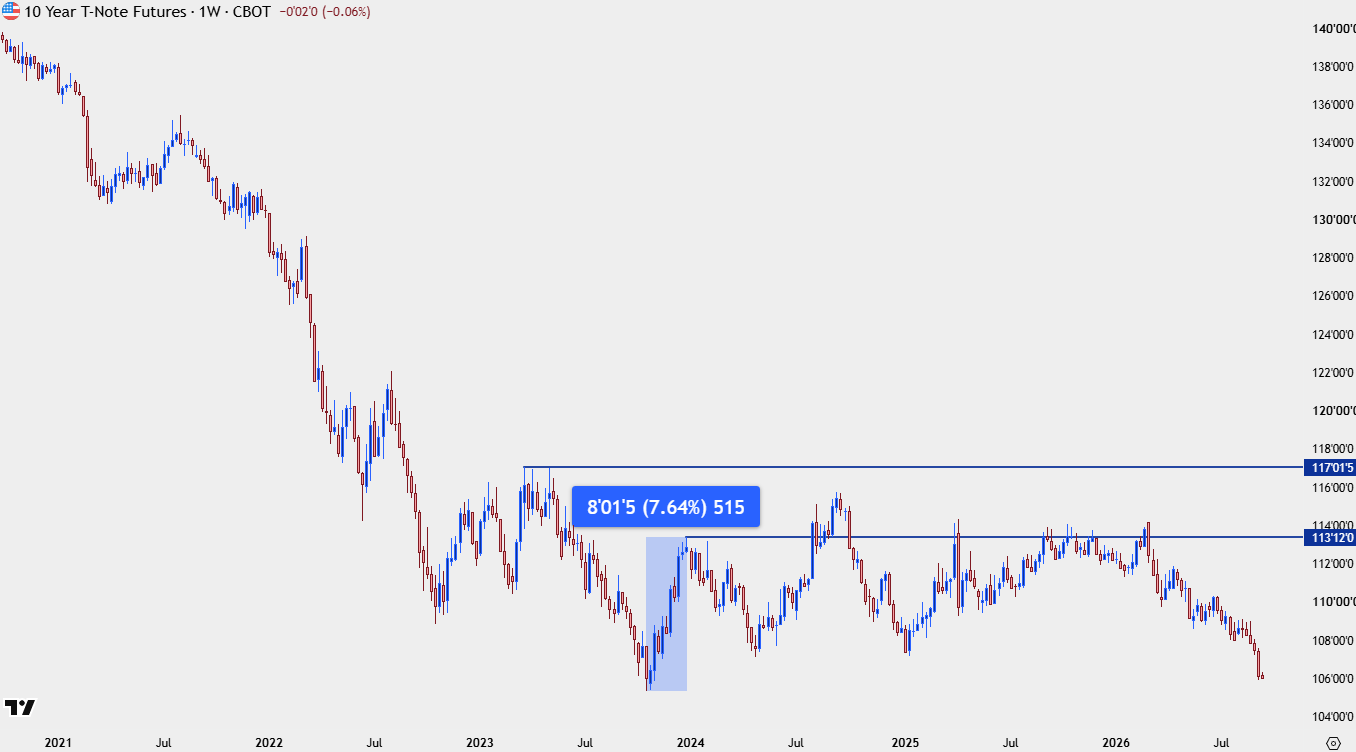
Chart prepared by James Stanley; data derived from Tradingview
Last week the 10-year came less than one basis point away from that 5% marker, and buyers already showed up. So logically that first test above 5% could lead to similar buying behavior.
But perhaps the bigger question is whether there’s enough power on the long side of the trade to lead to a similar reversal that showed back in 2023, because it was the shifting in the QRA that ultimately extended the move and with an upcoming maturity wall, current US Treasury Secretary Scott Bessent may not have as much flexibility as his predecessor.
The bigger level, in my opinion, is 5.25%, which traded twice back in 2006 and 2007 and this is where matters across markets shifted quickly, as the financial collapse drove capital flows into Treasuries and yields cratered soon after.
The attraction of locking in 10-year rates at 5.25% or 5% or even 4.5% in the midst of falling equity prices is undoubtably one of the factors that led to an exodus of capital from risk markets.
US 10-Year Note Yields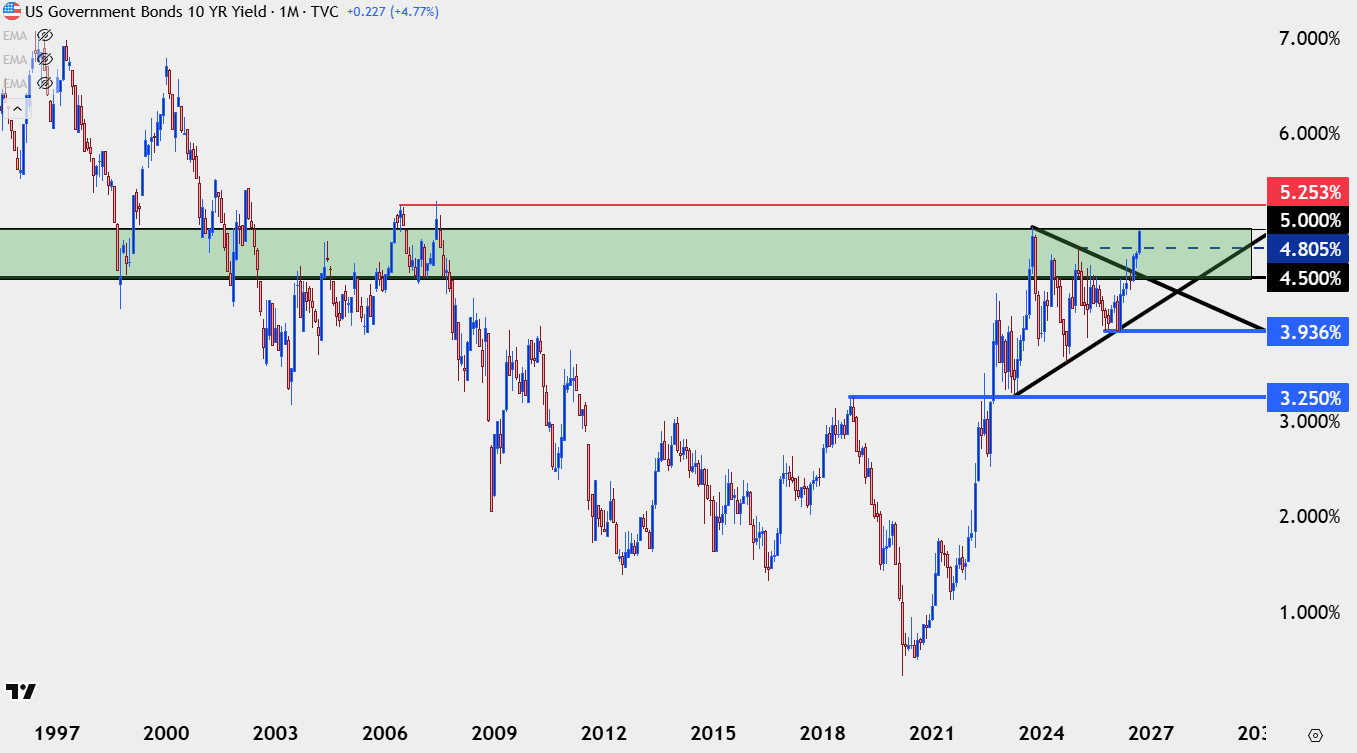
Chart prepared by James Stanley; data derived from Tradingview
Oil
Inflation data has been a major push point in the hawkish shift around the Fed in the past few months, and this has been even as oil prices have been relatively relaxed following the flare back in March. But oil strength is back again and WTI is testing above the $100 level.
This is the type of risk factor that’s difficult to ignore and it may even overshadow inflation to a degree because of the lag with which it takes for this to show in the data. With inflation already above target, and the Fed already expected to hike, higher oil prices aren’t doing any favors for the dovish crowd and this is something that can further press weakness in risk markets, especially if accompanied by a breakout in yields.
WTI Crude Oil Weekly Chart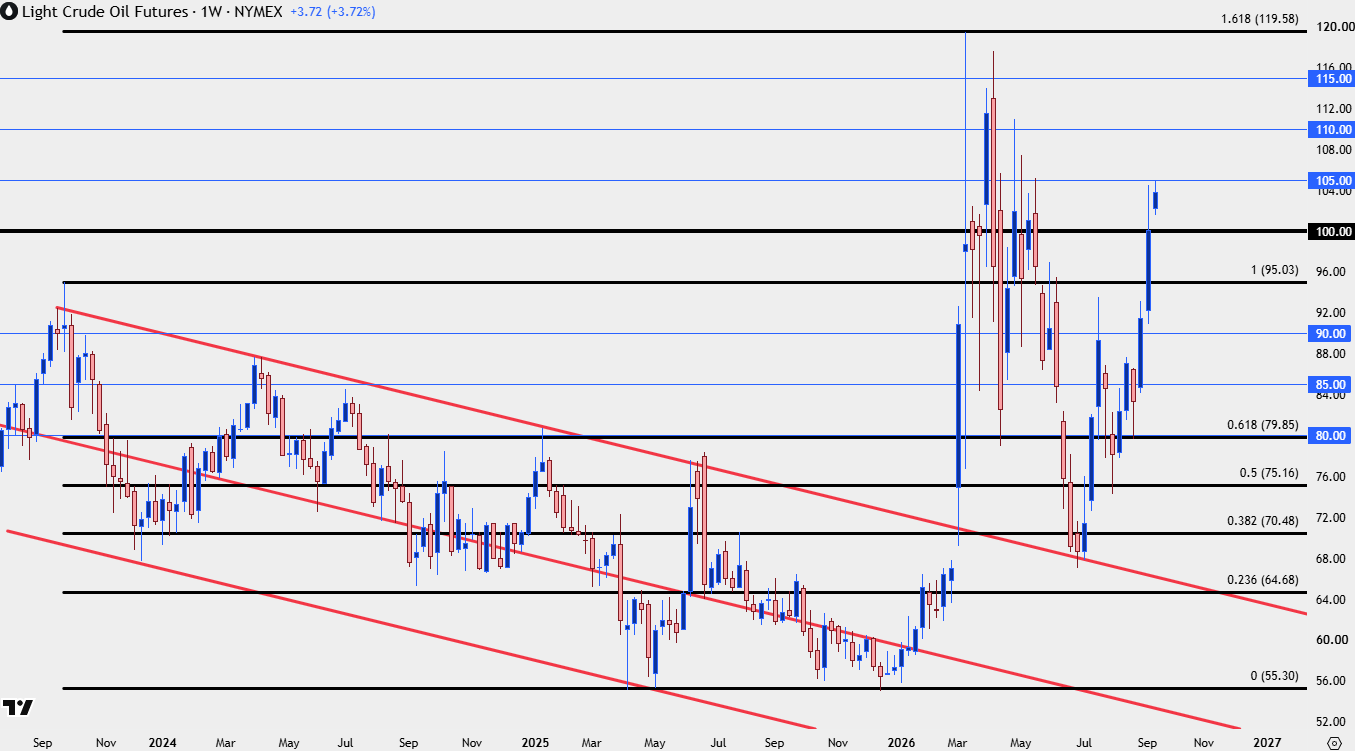
Chart prepared by James Stanley; data derived from Tradingview
USD/JPY

Both the Fed and BoJ are expected to hike rates this week but from a fundamental perspective there’s still logic for a bias towards the US side of the matter. Inflation data has generally been higher in the States with the exception of the recent PPI release and with both hikes largely priced-in, the bigger matter is what happens next.
In the US there’s already expectation for another hike by the end of the year, but with recent Japanese CPI at 1.9%, below their 2% target, is there really expectation for the BoJ to keep pace?
US Treasury Secretary Scott Bessent has certainly alluded to that case and this is a big reason why the pair isn’t back above the 160.00 level. He’s said he has asymmetric information, and he knows what the BoJ and Japanese policymakers will do, which thickens the drama for the Bank of Japan meeting later in the week.
USD/JPY Daily Price Chart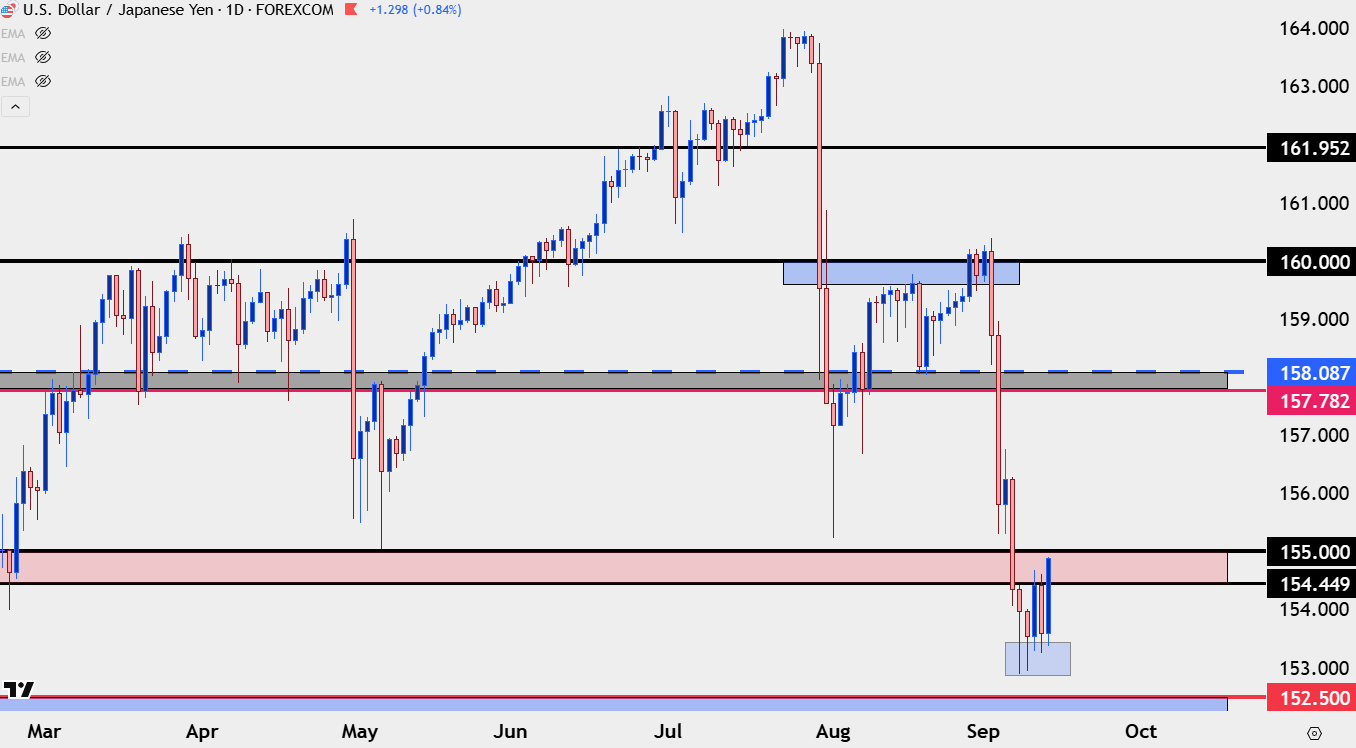
Chart prepared by James Stanley; data derived from Tradingview
SPX
It’s a Fed week and there’s massive interest around the yields move and the oil move and there was some drama around the AI trade over the weekend, so stocks have to make an appearance in this week’s edition.
I covered this in the weekend forecasts but at this point, SPX still retains a degree of strength given the hold of support at prior resistance. This looks a bit healthier than what’s shown in the tech-heavy Nasdaq and, collectively, that can be a worrisome sign that I’ll touch on below. But, for now, structure is bullish and if looking to buy the dip in stocks I think there’s a more cogent argument to be made here rather than in the Nasdaq.
SPX Daily Chart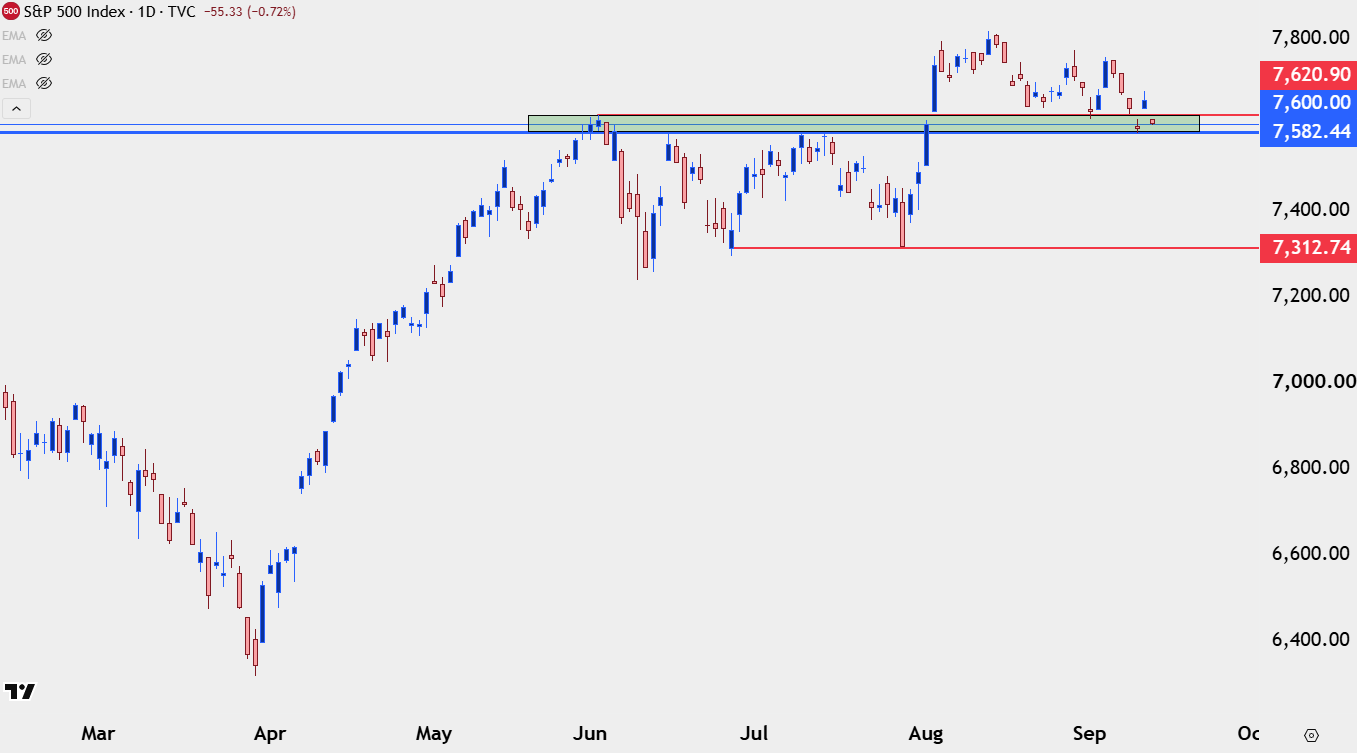
Chart prepared by James Stanley; data derived from Tradingview
Nasdaq 100
When the leader becomes the laggard, look out below. That was the case back in the year 2000 when tech stocks topped and started to sell-off a couple months ahead of the S&P 500. There was even a similar backdrop in yields at the time.
The logic of something like this is that late-stage equity buyers push in to markets with less aggressive valuations, and as chasing dips in high beta stocks becomes more and more painful. This type of dynamic has shown many other times, such as in July of 2024 when NQ started to sell-off almost instantly on the morning of July 11th, when a below-expected CPI print was coupled with a Japanese Yen intervention, and despite surging odds of rate cuts stocks began to tank. The S&P 500 took about a week to turn after the Nasdaq. And I had another prior instance of this back in February of 2020, just before the Covid pandemic came to light a month later although that instance is easier to dismiss given the shock of what happened.
At this point, I have the Nasdaq breaking a symmetrical triangle and testing a pretty major spot of support. If we do see fear taking over, whether that’s because of a super hawkish Fed or surging oil prices or Treasury yields breaking out- or perhaps a combination of those reasons – the Nasdaq makes for a more compelling case for shorts.
Nasdaq 100 Daily Chart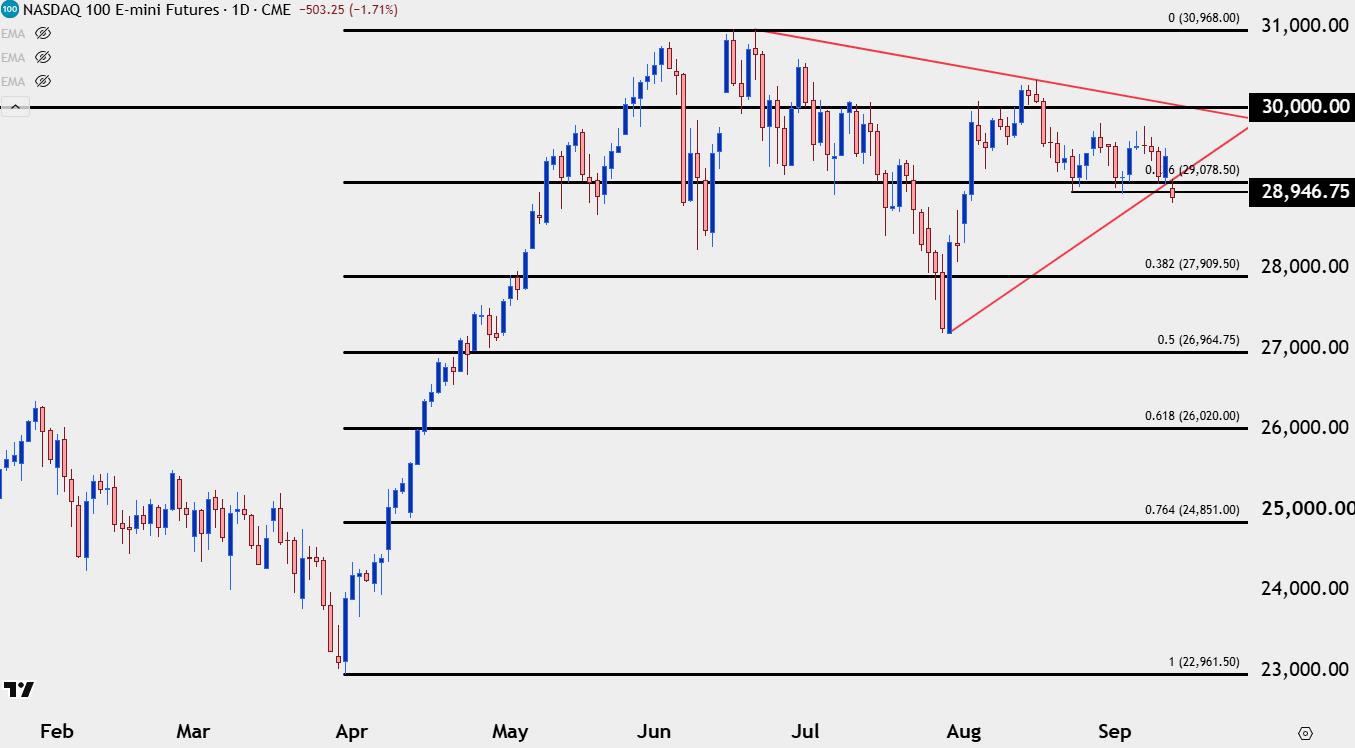
Chart prepared by James Stanley; data derived from Tradingview
--- written by James Stanley, Senior Market Analyst, Global Macro
Related tags:
Latest market news




Open an account in minutes
Experience award-winning platforms with fast and secure execution, and enjoy tight spreads from 0.5 pts on FX and 0.3 pts on indices.
Economic calendar
Web Trader platform
Our sophisticated web-based platform is packed with features.
Related articles
Pre-CPI USD Price Action Setups: EUR/USD, USD/JPY, GBP/USD, USD/CAD
Tomorrow brings an important inflation print as Treasury yields have started to stall and expectations for rate hikes have pared back. But another jolt to inflation could tilt those odds and impact price action across the USD complex.
Japanese Yen Short-term Outlook: USD/JPY Breakout Risk Builds Below 200-Day Average 10 13 2026
USD/JPY is trading in a narrow range beneath major resistance ahead of CPI, with the next breakout likely to set the near-term directional tone.

USD/JPY forecast: Dollar remains fundamentally supported ahead of CPI
The USD/JPY eased lower today with the greenback also declining against several other currencies. However, at the time of writing, oil prices were bouncing back and yields were off their lows again. The US dollar hadn’t moved much yet, but these forces could help it to regain its poise ahead of the release of US CPI on Wednesday.

This report is intended for general circulation only. It should not be construed as a recommendation, or an offer (or solicitation of an offer) to buy or sell any financial products. The information provided does not take into account your specific investment objectives, financial situation or particular needs. Before you act on any recommendation that may be contained in this report, independent advice ought to be sought from a financial adviser regarding the suitability of the investment product, taking into account your specific investment objectives, financial situation or particular needs.
StoneX Financial Pte. Ltd., may distribute reports produced by its respective foreign entities or affiliates within the StoneX group of companies or third parties pursuant to an arrangement under Regulation 32C of the Financial Advisers Regulations. Where the report is distributed to a person in Singapore who is not an accredited investor, expert investor or an institutional investor (as defined in the Securities Futures Act), StoneX Financial Pte. Ltd. accepts legal responsibility to such persons for the contents of the report only to the extent required by law. Singapore recipients should contact StoneX Financial Pte. Ltd. at 6826 9988 for matters arising from, or in connection with the report.
In the case of all other recipients of this report, to the extent permitted by applicable laws and regulations neither StoneX Financial Pte. Ltd. nor its associated companies will be responsible or liable for any loss or damage incurred arising out of, or in connection with, any use of the information contained in this report and all such liability is hereby expressly disclaimed. No representation or warranty is made, express or implied, that the content of this report is complete or accurate.
StoneX Financial Pte. Ltd. is not under any obligation to update this report.
Trading CFDs carries a high level of risk that may not be suitable for some investors. Consider your investment objectives, level of experience, financial resources, risk appetite and other relevant circumstances carefully. The possibility exists that you could lose some or all of your investments, including your initial deposits. If in doubt, please seek independent expert advice. Visit www.forex.com/en-sg/terms-and-policies for the complete Risk Disclosure Statement.