



US Dollar Price Action Setups into NFP: USD/JPY and GBP/USD in Focus
USD/JPY tests intervention risk near 158 while GBP/USD momentum fades ahead of NFP, with technical setups pointing to potential downside moves.
Share this:

FX markets are trading in typically subdued fashion ahead of Nonfarm Payrolls, although implied volatility suggests traders still expect sizeable moves once the data hits. USD/JPY remains sensitive to further intervention fears near 158, while GBP/USD is showing signs its multi-week rally is losing momentum. Here are the key technical setups to watch into NFP.
View related analysis:
View related analysis:
USD/JPY and GBP/USD Price Action Setups Ahead of NFP
FX Volatility Muted Ahead of NFP, Though GBP/USD and USD/JPY Stand Out
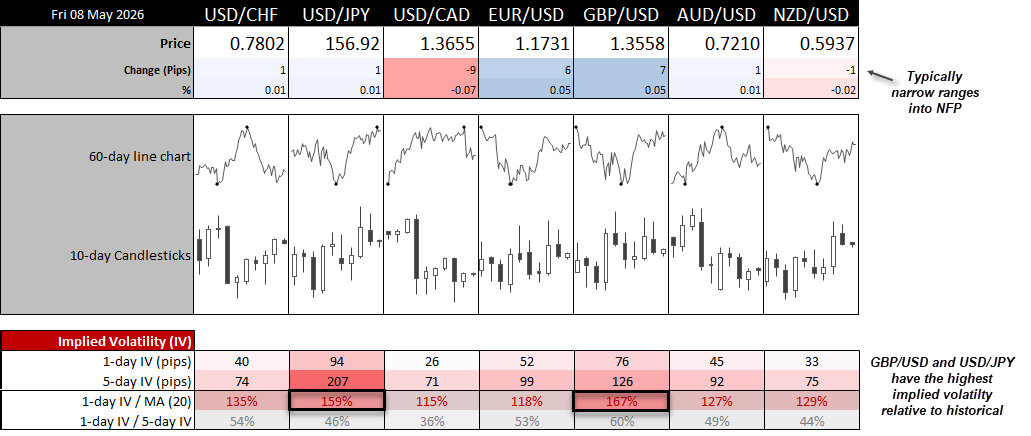
We’re seeing the usual minuscule ranges across FX majors on NFP day, with little reason to expect sudden moves without a surprise catalyst. Looking across implied volatility levels for the FX majors shows traders expect the most action in the British pound and Japanese yen. The 1-day IV for GBP/USD sits at 76 pips, equivalent to 167% of its 20-day ATR. For USD/JPY, 1-day IV sits at 94 pips (up or down), or 159% of its 20-day ATR. Do note, however, that 1-day IV for all FX majors is currently above 100% relative to their ATR(20).
Source: LSEG
USD/JPY Technical Analysis: US Dollar vs Japanese Yen
USD/JPY Drifts Higher After Intervention Shock, But Downside Risks Remain
Needless to say, there has been a decent amount of volatility on USD/JPY, most likely due to Japan’s Ministry of Finance (MOF) intervening in the yen at least twice since last Thursday. That has produced two notable selloff sessions, although prices are once again drifting higher during quieter trade.
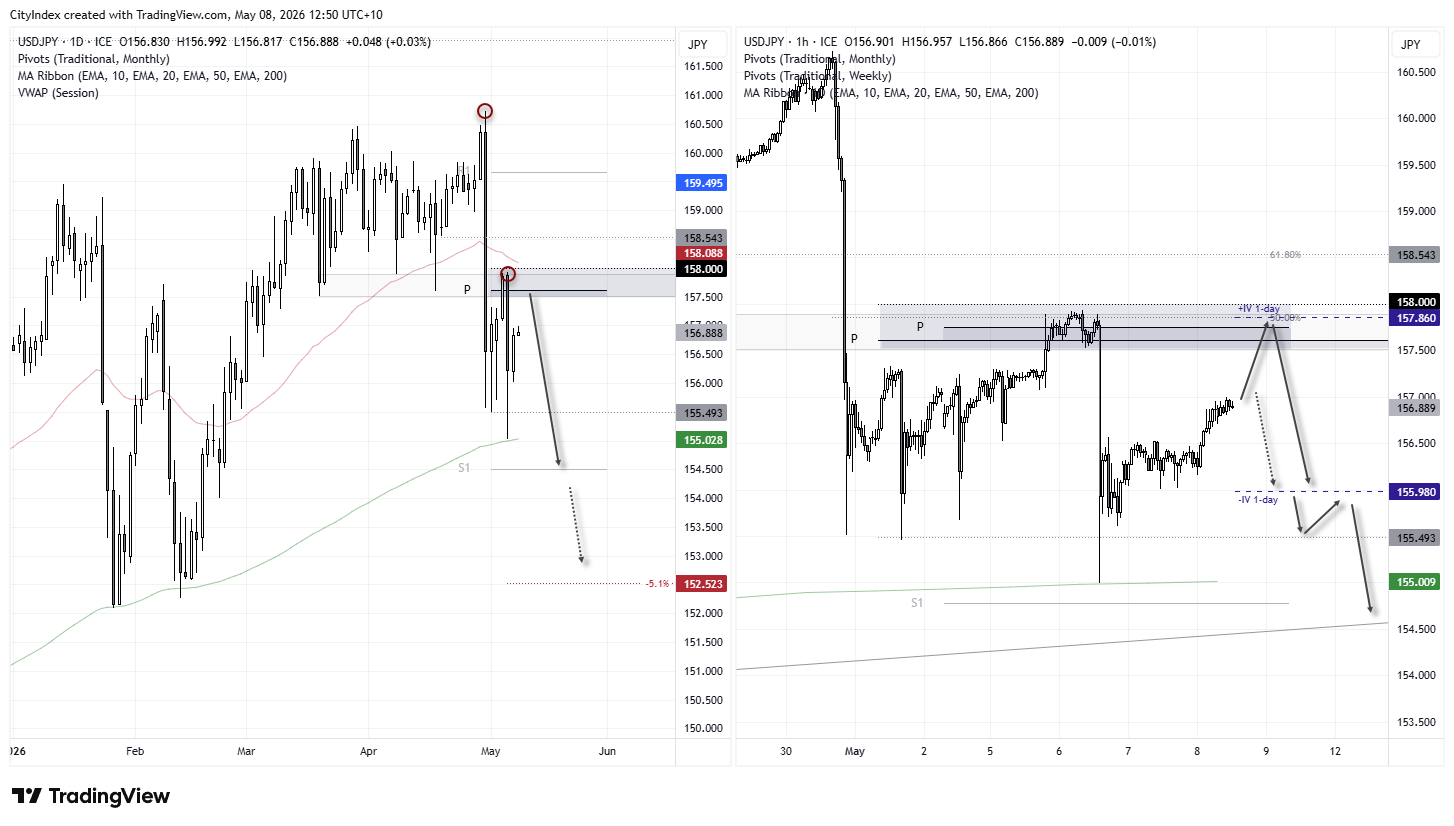
Given the most recent suspected intervention occurred just below 158, that level could become self-fulfilling resistance as bulls err on the side of caution should prices move back towards it. I outlined my reasoning for a much deeper decline in prior yen articles, largely because previous interventions have coincided with multi-week or multi-month declines. Even a smaller post-intervention move of -5.1% could send USD/JPY down to 152.52, while a -7.8% decline would target 148.19. A move below 140 could even come into view if we see a repeat of some of the double-digit declines witnessed throughout history.


USD/JPY Rebound Faces Heavy Resistance Around 158
The 1-hour chart shows prices drifting higher, but with so many technical levels around the 158 level – it seems a swing high up to or around that level could be likely. Between 157.50 – 15 we have the monthly and weekly pivot points, the upper 1-day IV, 50% retracement and prior support / resistance zone. So even if a strong NFP numbers are delivered, it could be a last hurrah before momentum turns and USD/JPY heads back towards the 200-day EMA around 155.
Source: ICE, TradingView
GBP/USD Technical Analysis: British Pound vs US Dollar
GBP/USD Rally Losing Momentum Beneath February VPOC
The British pound has staged a decent rally since the April low, with GBP/USD rising as much as 3.8% by last Friday’s high. However, much of that rally occurred over an eight-day period, and bullish momentum has clearly faded over the past three weeks.
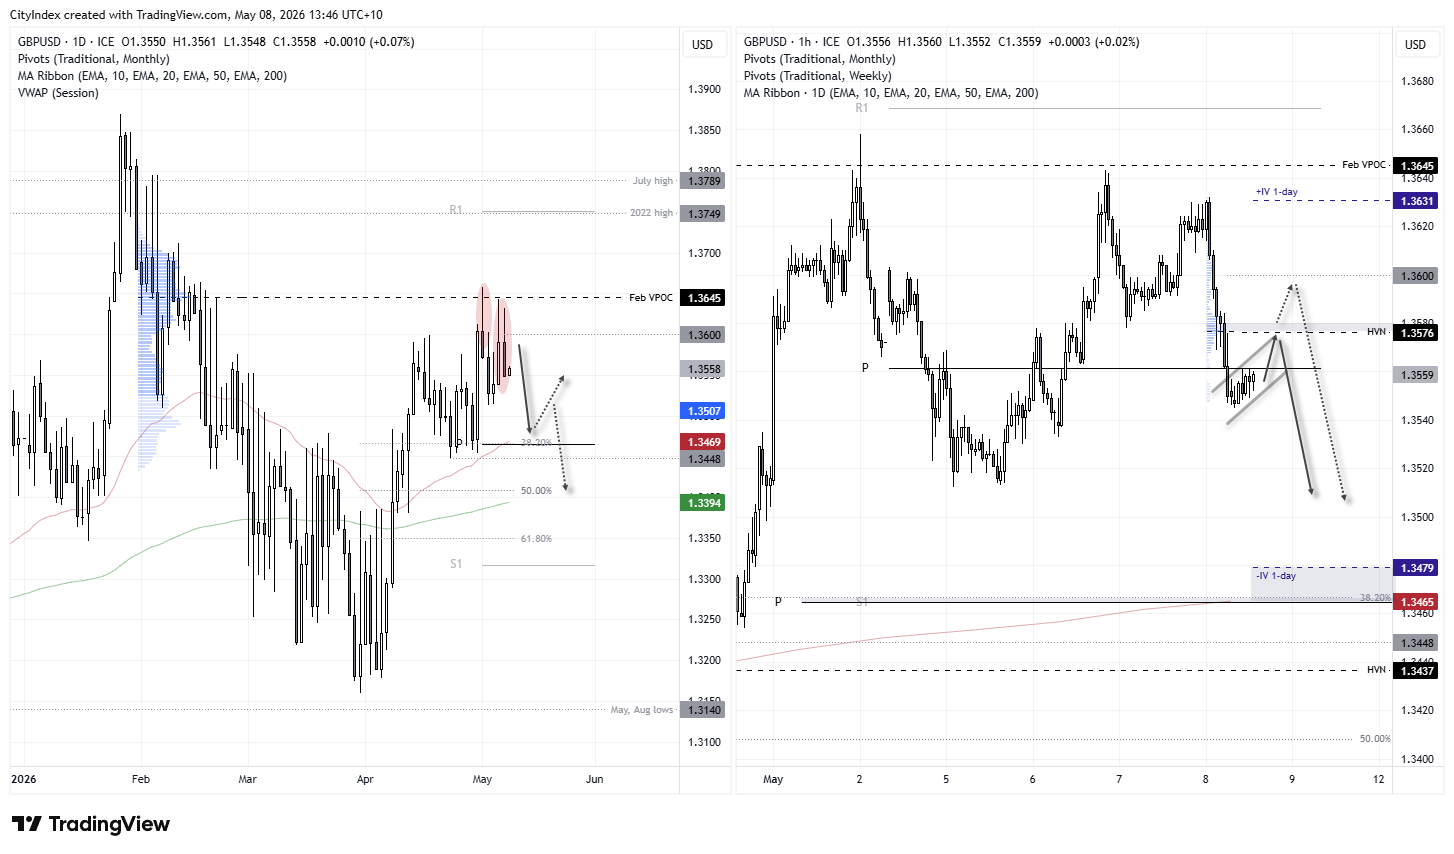
The fact the rally stalled around the February VPOC and may have since formed a lower high also hints at a downside move for GBP/USD. Note the three large upper wicks across the past five candles, suggesting bulls continue to lose momentum beneath the VPOC, while Thursday’s bearish inside candle also warns of a potential dip lower.
A move towards the 50-day EMA (1.3470), monthly pivot point (1.3465), or the 1.3448 swing low could now be on the cards.


GBP/USD Risks Further Weakness as Bear Flag Emerges
The 1-hour chart shows momentum turning sharply lower on Thursday. A small retracement — possibly a bear flag — is now forming near the cycle lows. Were it not for NFP, I would be more inclined to expect a clean breakdown, although the risk of another drift higher remains apparent.
Note the high-volume node (HVN) at 1.3576, which could act as resistance. Otherwise, I would look for evidence of a swing high towards 1.3600 on the assumption of a move lower towards 1.3470, near the 38.2% Fibonacci retracement level and 50-day EMA.
Source: ICE TradingView
View the full economic calendar
View the full economic calendar
-- Written by Matt Simpson
Follow Matt on Twitter @cLeverEdge
How to trade with City Index
You can trade with City Index by following these four easy steps:
- Open an account, or log in if you’re already a customer
• Open an account in the UK
• Open an account in Australia
• Open an account in Singapore
- Search for the market you want to trade in our award-winning platform
- Choose your position and size, and your stop and limit levels
- Place the trade
Related tags:


Open an account in minutes
Experience award-winning platforms with fast and secure execution, and enjoy tight spreads from 0.5 pts on FX and 0.3 pts on indices.
Economic calendar
Web Trader platform
Our sophisticated web-based platform is packed with features.
Related articles
USD/JPY weekly outlook: Quarter turn scrambles rates regime
USD/JPY’s tight relationship with front-end US rates broke down sharply last week, but quarter-turn flows and positioning suggest the disconnect may prove temporary.

USD/CAD forecast: rally could accelerate above June highs at 1.4250
USD/CAD recovered quickly after weaker US jobs data, keeping the bullish trend in focus. A move above the June highs could accelerate the rally as inflation keeps the Fed under pressure.


USD Sets Fresh Yearly High as EUR/USD Drops Dramatically, USD/JPY Stable
Well, it was a week of USD strength that wasn’t entirely pushed by USD/JPY, as a strong sell-off in EUR/USD has pushed the major pair to its most oversold state in a decade.

This report is intended for general circulation only. It should not be construed as a recommendation, or an offer (or solicitation of an offer) to buy or sell any financial products. The information provided does not take into account your specific investment objectives, financial situation or particular needs. Before you act on any recommendation that may be contained in this report, independent advice ought to be sought from a financial adviser regarding the suitability of the investment product, taking into account your specific investment objectives, financial situation or particular needs.
StoneX Financial Pte. Ltd., may distribute reports produced by its respective foreign entities or affiliates within the StoneX group of companies or third parties pursuant to an arrangement under Regulation 32C of the Financial Advisers Regulations. Where the report is distributed to a person in Singapore who is not an accredited investor, expert investor or an institutional investor (as defined in the Securities Futures Act), StoneX Financial Pte. Ltd. accepts legal responsibility to such persons for the contents of the report only to the extent required by law. Singapore recipients should contact StoneX Financial Pte. Ltd. at 6826 9988 for matters arising from, or in connection with the report.
In the case of all other recipients of this report, to the extent permitted by applicable laws and regulations neither StoneX Financial Pte. Ltd. nor its associated companies will be responsible or liable for any loss or damage incurred arising out of, or in connection with, any use of the information contained in this report and all such liability is hereby expressly disclaimed. No representation or warranty is made, express or implied, that the content of this report is complete or accurate.
StoneX Financial Pte. Ltd. is not under any obligation to update this report.
Trading CFDs carries a high level of risk that may not be suitable for some investors. Consider your investment objectives, level of experience, financial resources, risk appetite and other relevant circumstances carefully. The possibility exists that you could lose some or all of your investments, including your initial deposits. If in doubt, please seek independent expert advice. Visit www.forex.com/en-sg/terms-and-policies for the complete Risk Disclosure Statement.