


USD/JPY, AUD/JPY Outlook: Japanese Yen in Focus Ahead of Election
The Japanese yen remains under pressure as Japan’s election with AUD/JPY stretched at highs and USD/JPY testing key resistance.
Share this:

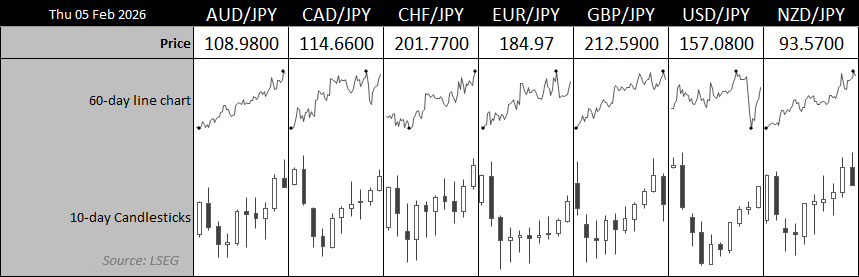
The Japanese yen remains among the weakest FX majors, a trend that has persisted throughout 2026 and the past year. The move has been overwhelmingly macro-driven, with wide rate differentials and ongoing policy divergence continuing to punish yen bulls and undermine mean-reversion strategies.
With Japan’s election taking place on Sunday, event risk is rising into the weekend. That combination keeps yen crosses such as AUD/JPY and USD/JPY firmly in focus, particularly as stretched positioning and key technical levels raise the risk of short-term volatility.
View related analysis:
View related analysis:
Source: LSEG
Japanese Yen Outlook: AUD/JPY and USD/JPY Face Key Tests Ahead of Election
The Japanese yen continues to underperform, remaining among the weakest FX majors this week — which comes as little surprise given it has also been the weakest major currency throughout 2026 and over the past year. The move has been overwhelmingly macro-driven, with wide rate differentials and persistent policy divergence repeatedly making a mockery of mean-reversion strategies.
However, with Japan’s election taking place on Sunday, yen bears may want to tread more carefully into the weekend. Some traders are likely to hedge weekend gap risk or trim carry exposure in yen crosses such as AUD/JPY, NZD/JPY and MXN/JPY into Friday’s close.
It is widely assumed that Japan’s Prime Minister, Sanae Takaichi, favours a weak but stable Japanese yen. The Ministry of Finance has provided no evidence of FX intervention despite last week’s volatility, and unless the Bank of Japan signals a materially faster path toward policy normalisation, the yen appears likely to be allowed to drift lower.
A stronger yen would tighten financial conditions and undermine reflation efforts — clearly not part of the current policy agenda.
Japan Election Timeline and Market Risk
Japan’s election will be held on Sunday, though the process is far quicker than in the US or Europe:
- Exit polls: released shortly after polls close (Sunday evening Japan time)
- Clear result: usually within a few hours
- Markets know the outcome before Tokyo opens on Monday
This leaves the Japanese yen — and particularly the Nikkei 225 — exposed to weekend gap risk should an unexpected result or headline emerge. That said, Takaichi remains the firm favourite, which helps explain why the snap election was called just three months into her term.
As a result, Monday’s market reaction is likely to be muted and largely confined to Japanese assets, if there is a reaction at all. Still, investors tend to dislike unnecessary risk, leaving the door open for modest yen inflows into the weekend as a precautionary hedge.


AUD/JPY Technical Analysis: Australian Dollar vs Japanese Yen
AUD/JPY at 35-Year High as Monthly Rally Nears Statistical Limits
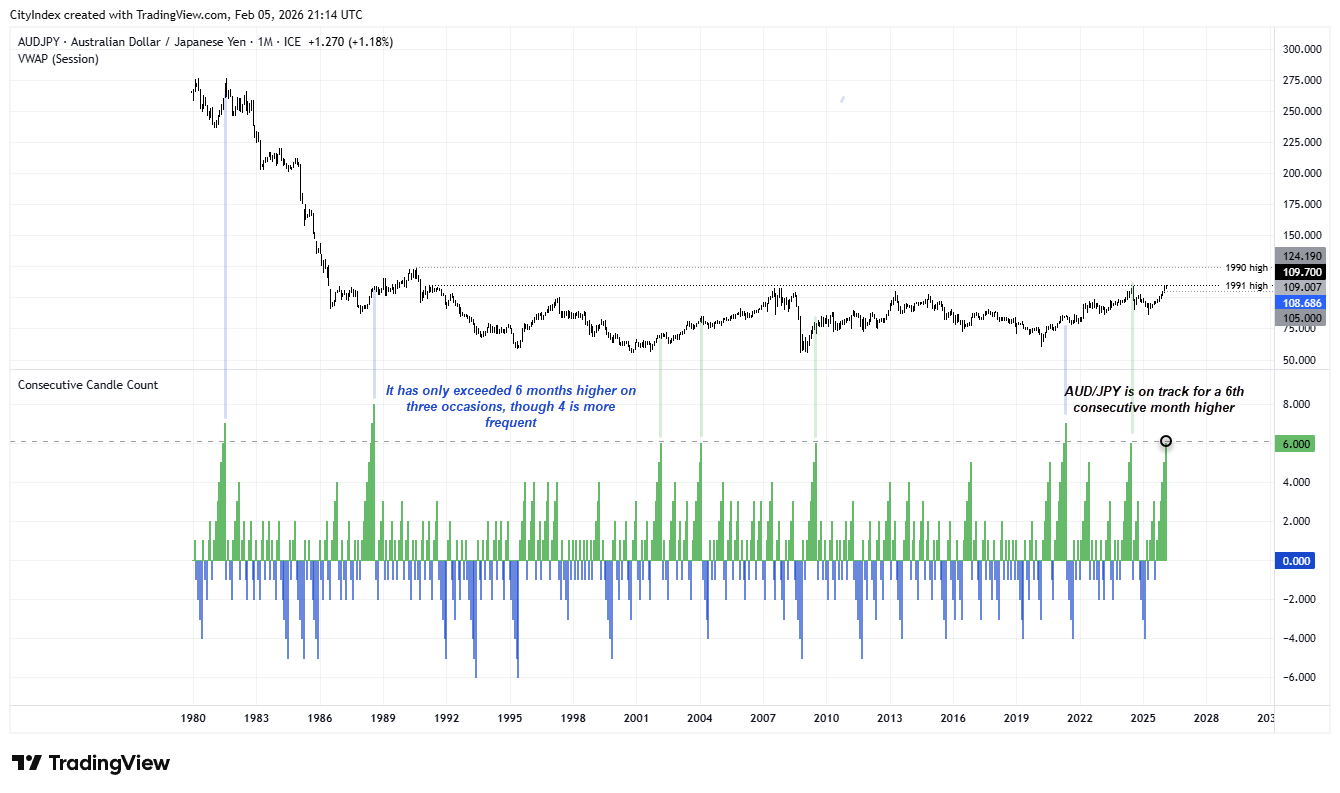
Zooming out to the bigger picture, AUD/JPY reached a 35-year high earlier this week. While it is still early in the month, the cross is on track for a sixth consecutive monthly gain — a stretch that historically coincides with late-cycle dynamics.
Using spot data from ICE going back to 1980, AUD/JPY has only extended beyond six bullish months on three occasions. More often, extended rallies have stalled after four to five months. While the broader macro backdrop does not yet point to a structural reversal, the pair may be approaching a near-term inflection point from a technical and statistical perspective.
For now, the Australian dollar continues to benefit from yield support and risk resilience, but with positioning stretched and event risk rising, AUD/JPY looks increasingly vulnerable to consolidation rather than another clean leg higher.
Source: ICE, TradingView
AUD/JPY Pulls Back After Rejection at 1991 High
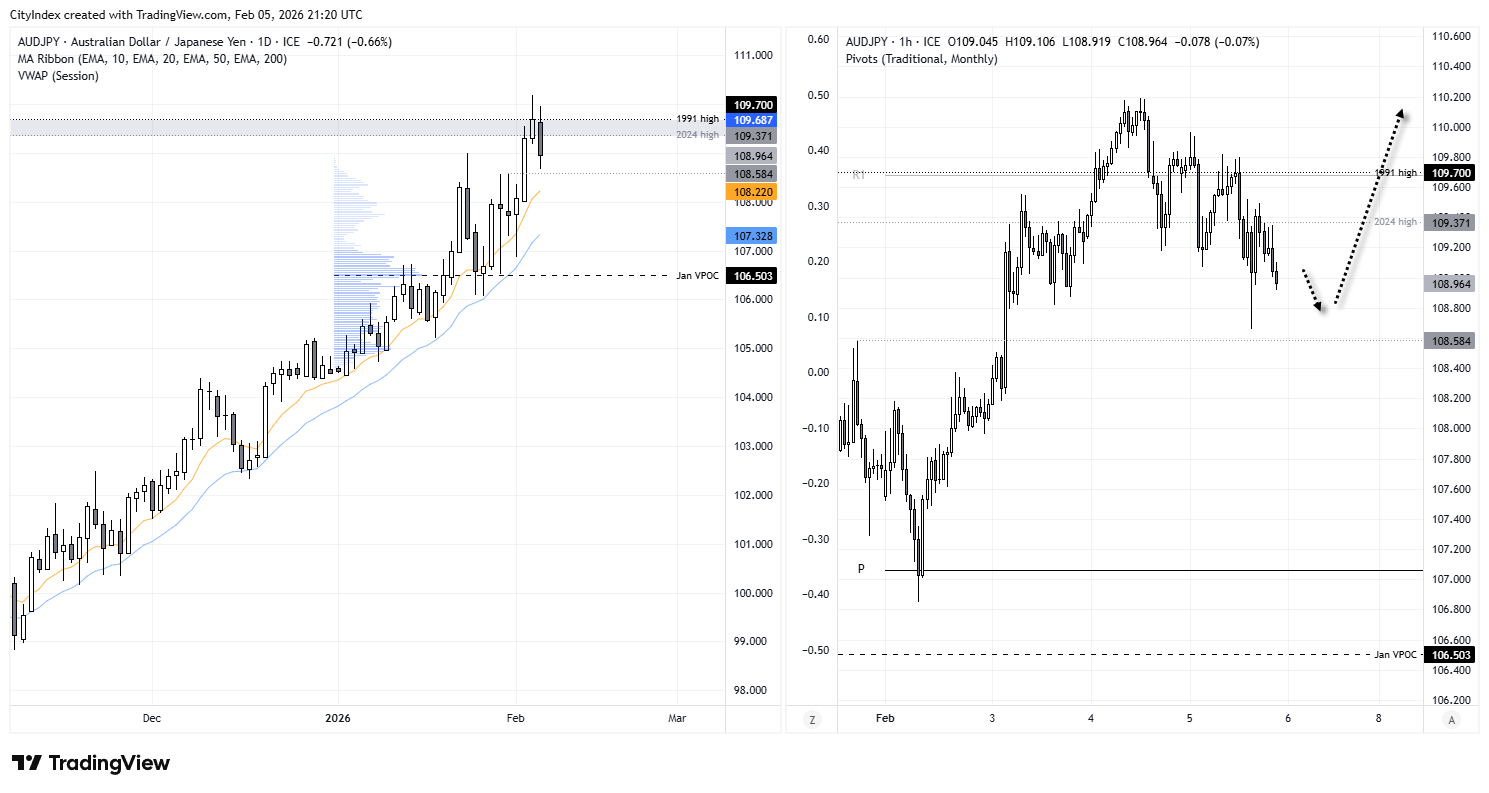
AUD/JPY retraced on Thursday after failing to secure a close above the 1991 high on Wednesday. Prices remain extended from the 10-day EMA, so some mean reversion is reasonable — though there is still little evidence to argue for a deep retracement.
The 1-hour chart shows price action slipping lower in a corrective manner, characterised by choppy, overlapping candles rather than impulsive selling. The bias remains for a shallow pullback, with prices ideally holding above 108.00 — or at worst the 108.58 breakout level — into the weekend. If that support zone holds, the broader bullish trend remains intact, with scope for upside momentum to resume next week.
Source: ICE, TradingView


USD/JPY Technical Analysis: US Dollar vs Japanese Yen
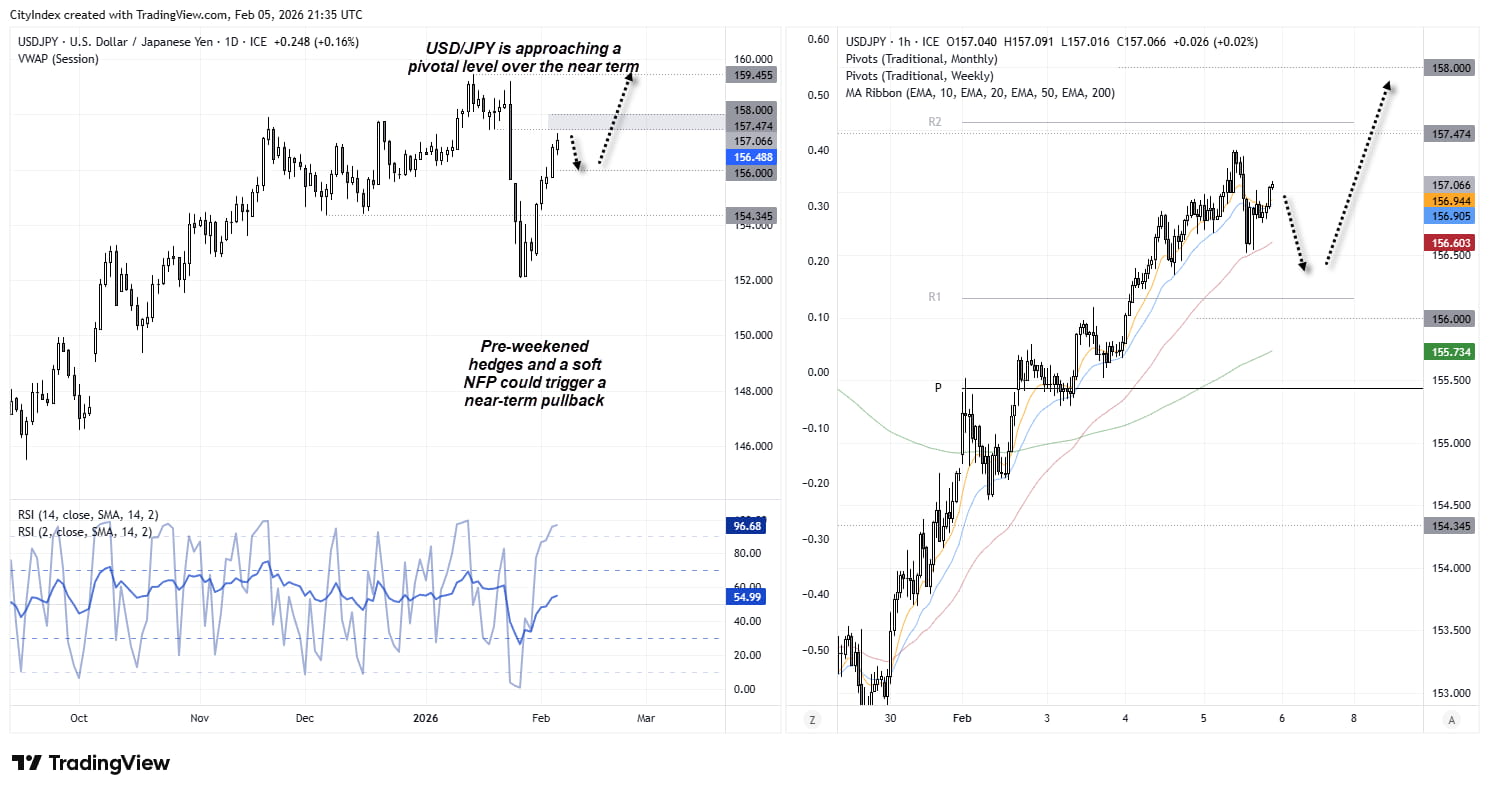
USD/JPY appears to be approaching a pivotal zone as markets head into the weekend and Japan’s election. While the pair has rebounded around 3.4% from its January low, it has yet to fully retrace the sharp losses seen during the volatile three-day sell-off that sparked speculation over possible Ministry of Finance (MOF) intervention.
The 157.47 swing low sits nearby, with the 158.00 handle just above - a zone which could attract sellers looking to fade rallies.
However, a strong push above 158.00 could help bulls refocus on a potential move toward 160.00 — especially if Sanae Takaichi secures victory in the election as expected.
Source: ICE, TradingView
View the full economic calendar
View the full economic calendar
-- Written by Matt Simpson
Follow Matt on Twitter @cLeverEdge
How to trade with City Index
You can trade with City Index by following these four easy steps:
- Open an account, or log in if you’re already a customer
• Open an account in the UK
• Open an account in Australia
• Open an account in Singapore
- Search for the market you want to trade in our award-winning platform
- Choose your position and size, and your stop and limit levels
- Place the trade
Related tags:



Open an account in minutes
Experience award-winning platforms with fast and secure execution, and enjoy tight spreads from 0.5 pts on FX and 0.3 pts on indices.
Economic calendar
Web Trader platform
Our sophisticated web-based platform is packed with features.
Related articles
Australian Dollar Outlook: AUD/USD Screams Sentiment Extreme Into Fed, CPI
AUD/USD rebounds despite record bearish futures positioning, with Australian Q3 CPI and the Fed meeting threatening to trigger another short squeeze.

EUR/USD weekly outlook: FOMC and ECB to set the tone
The current backdrop is modestly bearish. On Friday, the EUR/USD closed modestly lower, down for the third consecutive day. The pair also posted a weekly decline after staging a modest recovery attempt in the previous week. Out of the past 8 weeks, the EUR/USD has fallen on 6 occasions. There is not much supporting factors for the single currency right now. So, the upside remains capped.


USD/JPY Weekly Outlook: AI earnings could overshadow the Fed and BoJ
AI sentiment has become a major driver of US Treasury yields and USD/JPY. With Microsoft, Alphabet and Amazon reporting this week, central bank decisions may have competition for traders' attention.

This report is intended for general circulation only. It should not be construed as a recommendation, or an offer (or solicitation of an offer) to buy or sell any financial products. The information provided does not take into account your specific investment objectives, financial situation or particular needs. Before you act on any recommendation that may be contained in this report, independent advice ought to be sought from a financial adviser regarding the suitability of the investment product, taking into account your specific investment objectives, financial situation or particular needs.
StoneX Financial Pte. Ltd., may distribute reports produced by its respective foreign entities or affiliates within the StoneX group of companies or third parties pursuant to an arrangement under Regulation 32C of the Financial Advisers Regulations. Where the report is distributed to a person in Singapore who is not an accredited investor, expert investor or an institutional investor (as defined in the Securities Futures Act), StoneX Financial Pte. Ltd. accepts legal responsibility to such persons for the contents of the report only to the extent required by law. Singapore recipients should contact StoneX Financial Pte. Ltd. at 6826 9988 for matters arising from, or in connection with the report.
In the case of all other recipients of this report, to the extent permitted by applicable laws and regulations neither StoneX Financial Pte. Ltd. nor its associated companies will be responsible or liable for any loss or damage incurred arising out of, or in connection with, any use of the information contained in this report and all such liability is hereby expressly disclaimed. No representation or warranty is made, express or implied, that the content of this report is complete or accurate.
StoneX Financial Pte. Ltd. is not under any obligation to update this report.
Trading CFDs carries a high level of risk that may not be suitable for some investors. Consider your investment objectives, level of experience, financial resources, risk appetite and other relevant circumstances carefully. The possibility exists that you could lose some or all of your investments, including your initial deposits. If in doubt, please seek independent expert advice. Visit www.forex.com/en-sg/terms-and-policies for the complete Risk Disclosure Statement.