







USD/JPY bull flag could temp bulls, ASX traders eye Wall Street stability
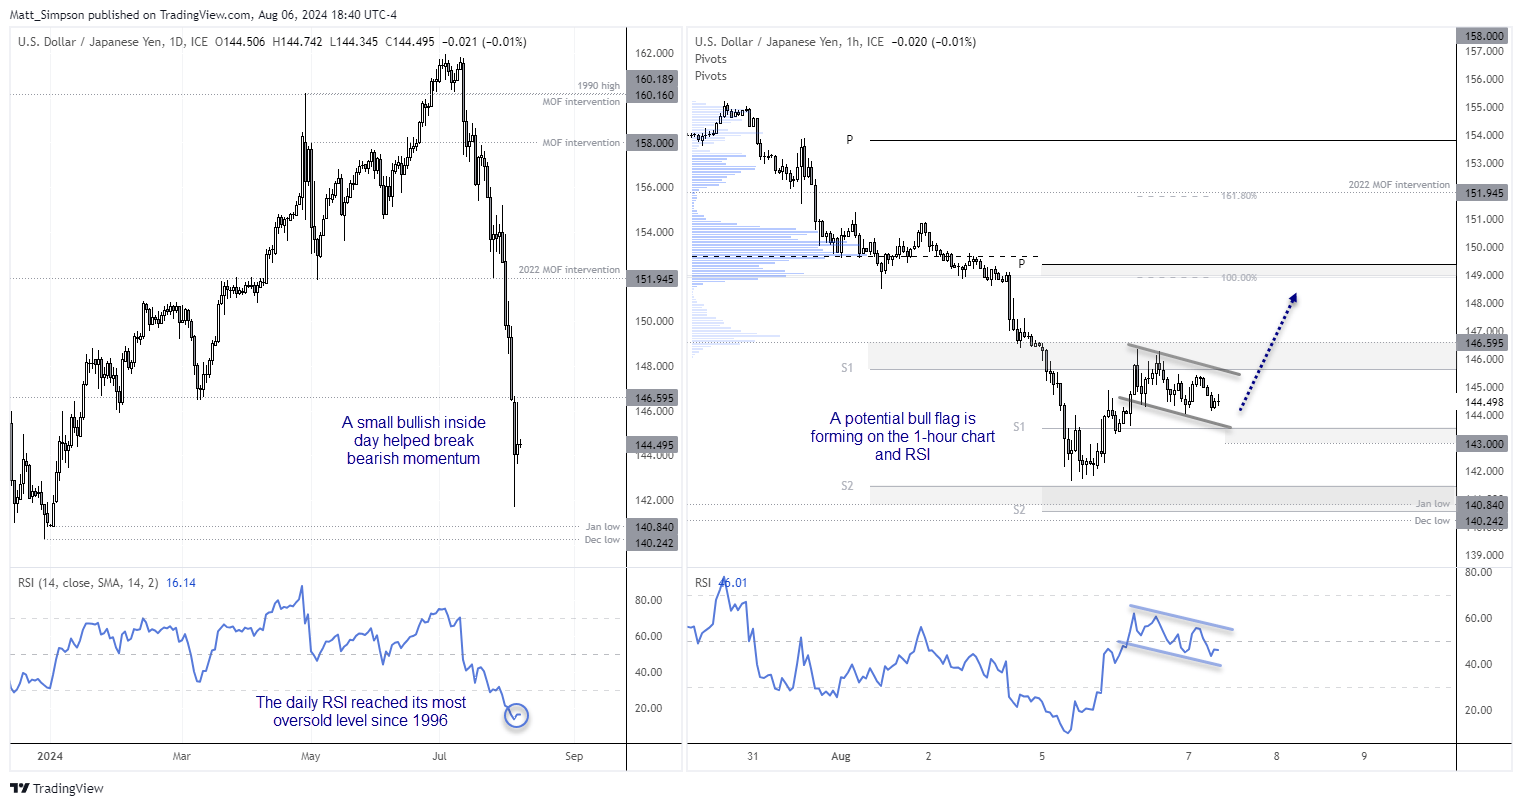
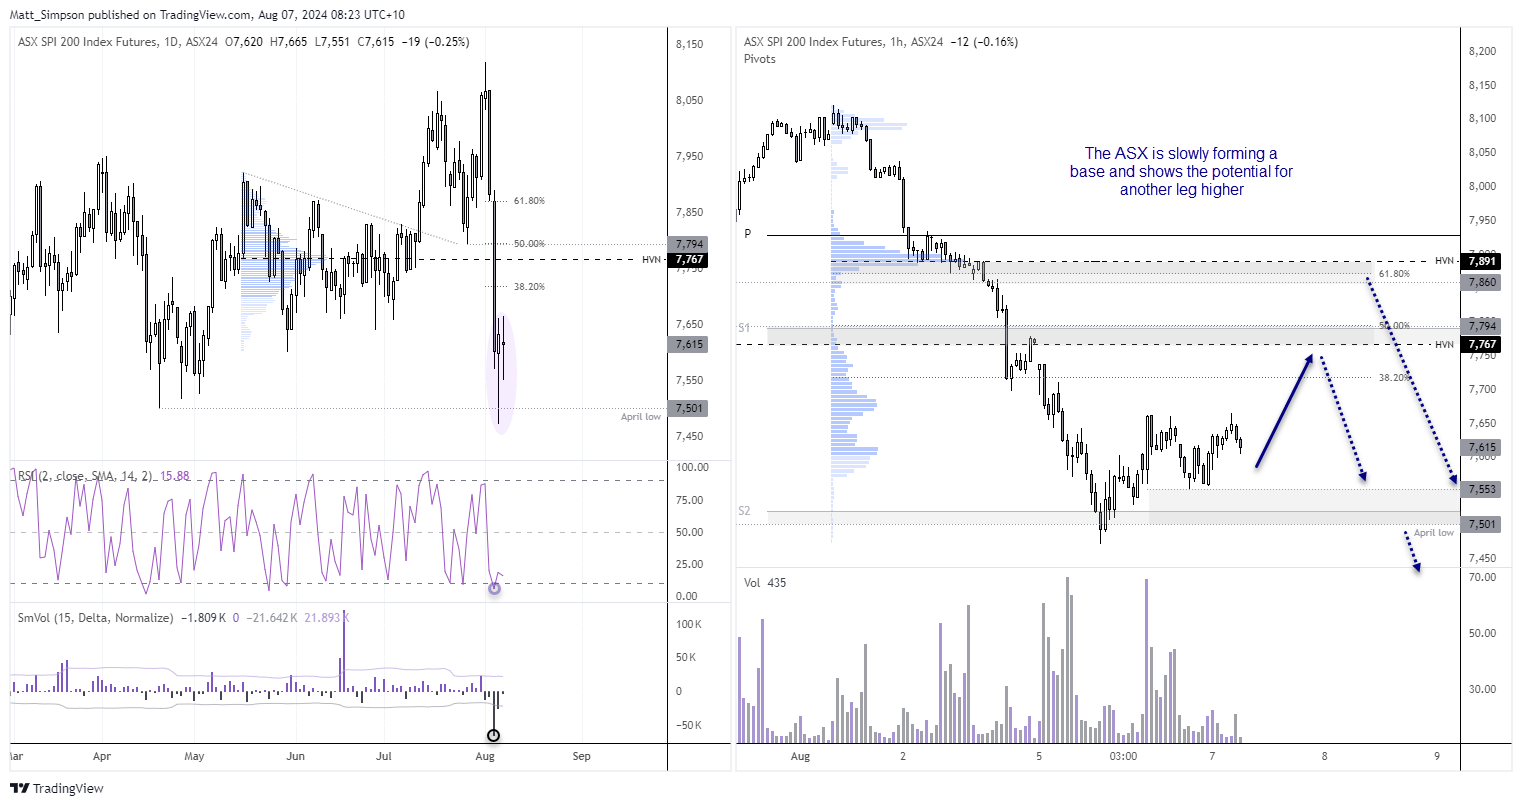
With USD/JPY holding above key support after the daily RSI reached its most oversold level since 1996, the 1-hour bull flag could tempt bulls. The ASX 200 also shows the potential for another leg higher, even if small.
Share this:

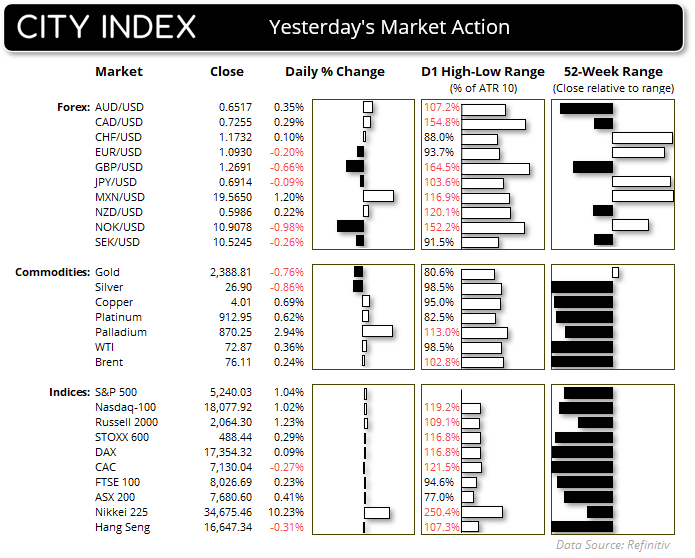
Monday’s broad risk-off rout was beginning to look like nothing more than a bad dream early on Tuesday, with Wall Street indices recouping most of Monday’s losses early in yesterday’s session. Reassuring comments from the Fed that the job market slowdown does not signal a recession at least helped sooth fears of emergency Fed rate cuts and a hard landing. As did the better-than-expected ISM services report, and Atlanta Fed’s GDPnow estimating Q3 GDP at 2.9%, above the 2.9% expected. Yet Fed fund futures are still pricing in three 25bp cuts over the next three meetings with a 74% probability.
While the S&P 500, Nasdaq and Dow Jones closed the day between 0.7% to 1% higher, much of their earlier gains were handed back by the close. And this serves as a reminder that we may not be out of the woods, as strong rebounds can and do occur in even the grizzliest of bear markets. If that was a turnaround Tuesday, it was a lame one indeed. Still, stability is the first step towards recovery.

The VIX closed lower for the first day in four, after marking its largest 1-day spike in history on Monday. As noted, the VIX rarely stays elevated for long. But it is still soon to tell whether things are just heating up or Monday was merely a blip.
The VIX closed lower for the first day in four, after marking its largest 1-day spike in history on Monday. As noted, the VIX rarely stays elevated for long. But it is still soon to tell whether things are just heating up or Monday was merely a blip.
AUD/USD and NZD/USD were the strongest FX majors, supported by improved sentiment and the RBA’s hawkish hold. The cash rate remained at 4.35% for a sixth consecutive meeting, and I see little reason for this to change in either direction at all this year. While governor Bullock confirmed they had discussed raising the cash rate at this meeting, it seems to be more of a formality than a threat. Cuts have been firmly ruled out, and although headline CPI is expected to dip within the RBA’s 1-3% target early next year, underlying inflation is expected to slow more gradually than expected.
GBP/USD was the weakest FX major as traders price in 100bp of potential Fed cuts versus 50bp from the BOE. Sterling closed below 1.27 for the first time in nearly 5 weeks and is on track for a fourth consecutive week lower. Consequently, GBP/AUD has fallen to an 11-day low after falling over 600 pips from Monday’s high, where it briefly traded above 2.0.
Events in focus (AEDT):
- 08:45 – NZ employment
- 13:00 – CN trade balance
- 16:00 – DE industrial production
- 00:00 – CA Ivey PMI
USD/JPY technical analysis:
The -12.5% fall since the July high on USD/JPY is not quite as impressive is the Nikkei’s -12.5% plunge on Monday, but it is impressive none the less. But with its daily RSI (14) dropping to its most oversold level since 1996, something had to give. And that saw USD/JPY form a bullish inside day on Tuesday. A small victory perhaps, but it still breaks up bearish momentum.
The 1-hour chart shows a potential bull flag which is also being confirmed by its RSI. A 100% projection level of the flag lands around the weekly pivot point and a high-volume node (HVN), which makes the 149 area a potential upside target for bears. Assuming risk is allowed to recover. While traders should be on guard for spikes lower around the Tokyo open, dips look tempting after such a selloff and the stock-market rout has paused for breath.
ASX 200 futures (SPI 200) technical analysis:
A bullish hammer formed on the ASX futures chart on Tuesday after it recovered from a false break of its April low. The magnitude of the 8% decline from the record high remains the dominant feature of the daily chart, but it could still make room for a bit more of a corrective bounce – even if its eventual destiny is lower from here. Also note the very negative delta volume that accompanied Monday’s bearish candle, which suggests bears waded in with force and that many may have already closed out following the reversal back above the April low.
The 1-hour chart shows classic corrective price behaviour. But that does not rule out further gains, even if only minor.
View the full economic calendar
View the full economic calendar
-- Written by Matt Simpson
Follow Matt on Twitter @cLeverEdge
How to trade with City Index
You can trade with City Index by following these four easy steps:
- Open an account, or log in if you’re already a customer
• Open an account in the UK
• Open an account in Australia
• Open an account in Singapore
- Search for the market you want to trade in our award-winning platform
- Choose your position and size, and your stop and limit levels
- Place the trade

Open an account in minutes
Experience award-winning platforms with fast and secure execution, and enjoy tight spreads from 0.5 pts on FX and 0.3 pts on indices.
Economic calendar
Web Trader platform
Our sophisticated web-based platform is packed with features.
Related articles

USD/JPY weekly outlook: Quarter turn scrambles rates regime
USD/JPY’s tight relationship with front-end US rates broke down sharply last week, but quarter-turn flows and positioning suggest the disconnect may prove temporary.


USD/CAD forecast: rally could accelerate above June highs at 1.4250
USD/CAD recovered quickly after weaker US jobs data, keeping the bullish trend in focus. A move above the June highs could accelerate the rally as inflation keeps the Fed under pressure.


USD Sets Fresh Yearly High as EUR/USD Drops Dramatically, USD/JPY Stable
Well, it was a week of USD strength that wasn’t entirely pushed by USD/JPY, as a strong sell-off in EUR/USD has pushed the major pair to its most oversold state in a decade.
This report is intended for general circulation only. It should not be construed as a recommendation, or an offer (or solicitation of an offer) to buy or sell any financial products. The information provided does not take into account your specific investment objectives, financial situation or particular needs. Before you act on any recommendation that may be contained in this report, independent advice ought to be sought from a financial adviser regarding the suitability of the investment product, taking into account your specific investment objectives, financial situation or particular needs.
StoneX Financial Pte. Ltd., may distribute reports produced by its respective foreign entities or affiliates within the StoneX group of companies or third parties pursuant to an arrangement under Regulation 32C of the Financial Advisers Regulations. Where the report is distributed to a person in Singapore who is not an accredited investor, expert investor or an institutional investor (as defined in the Securities Futures Act), StoneX Financial Pte. Ltd. accepts legal responsibility to such persons for the contents of the report only to the extent required by law. Singapore recipients should contact StoneX Financial Pte. Ltd. at 6826 9988 for matters arising from, or in connection with the report.
In the case of all other recipients of this report, to the extent permitted by applicable laws and regulations neither StoneX Financial Pte. Ltd. nor its associated companies will be responsible or liable for any loss or damage incurred arising out of, or in connection with, any use of the information contained in this report and all such liability is hereby expressly disclaimed. No representation or warranty is made, express or implied, that the content of this report is complete or accurate.
StoneX Financial Pte. Ltd. is not under any obligation to update this report.
Trading CFDs carries a high level of risk that may not be suitable for some investors. Consider your investment objectives, level of experience, financial resources, risk appetite and other relevant circumstances carefully. The possibility exists that you could lose some or all of your investments, including your initial deposits. If in doubt, please seek independent expert advice. Visit www.forex.com/en-sg/terms-and-policies for the complete Risk Disclosure Statement.