





USD/JPY Outlook: Bullish Momentum Builds Ahead of CPI and FOMC Commentary
USD/JPY eyes key resistance as traders brace for US CPI and dovish Fed speculation amid softening yen sentiment and rising political pressure.
Share this:

The US dollar continues to strengthen against the Japanese yen, with USD/JPY now flirting with the upper boundary of a key technical pattern. With the June US CPI report due today and a barrage of FOMC speakers this week, traders are watching closely for clues on whether inflation is genuinely sticky—or simply transitory noise from base effects and tariff fears. Positioning data and chart patterns are beginning to favour further upside for USD/JPY, though volatility is likely as markets digest the data and political reaction.
View related analysis:
View related analysis:
Bullish USD/JPY Momentum Builds as CPI and Fed Outlook Take Centre Stage
We have a slew of FOMC speakers lined up this week, and today’s US CPI report could shape the tone of their messaging. Jerome Powell recently outlined his expectation that Trump’s proposed tariffs would begin feeding into inflation during the summer months, making June’s CPI figures especially important. But we also have the ‘basing effect’ to factor in, which has seen forecasts for CPI to rise to 3% y/y (or 0.3% m/m) and CPI rise to 2.6% y/y or (0.3% m/m).
Traders then need to decipher whether any uptick in inflation is due to the basing effect or Trump’s tariffs and whether it is ‘transitory’. In either case I have a hard time believing today’s CPI release will allow the Fed to cut at their next meeting, so it really comes down to shift the odds for a September cut.
Fed Fund futures currently imply a 59.3% chance of a September cut. And expectations for higher CPI may have set the stage for even a modest uptick in inflation being interpreting it as ‘transitory’. So unless CPI prints well above expectations, traders could argue that inflation isn’t as concerning as Powell implies.
Naturally, any signs of soft inflation data could prompt Trump to weigh in, likely criticising the Fed — and Powell directly — for not already cutting rates by 100 basis points. Expect some political fireworks if the data underwhelms.

Chart prepared by Matt Simpson, data source: Bureau of Labor Statistics (LBS), London Stock Exchange Group (LSEG)
COT Data Signals Bullish Shift for USD/JPY as Yen Positioning Softens
Last week I outlined a technically bearish scenario for USD/JPY based around a potential symmetrical triangle pointing towards and eventual downside breakout on the weekly chart. Yet bearish momentum is clearly lacking and USD/JPY has risen over 1% since Thursday. This means prices for USD/JPY are at the extreme upper limits for the triangle, and therefore on the verge of being scrapped.
I also noted in yesterday’s COT report that net-short exposure to the US dollar index could be at a sentiment extreme for bears and that net-long exposure for yen futures might continue lower, given the reduction in short bets against the Japanese yen in recent weeks alongside a rise of longs. And that is bullish for USD/JPY should that trend continue.
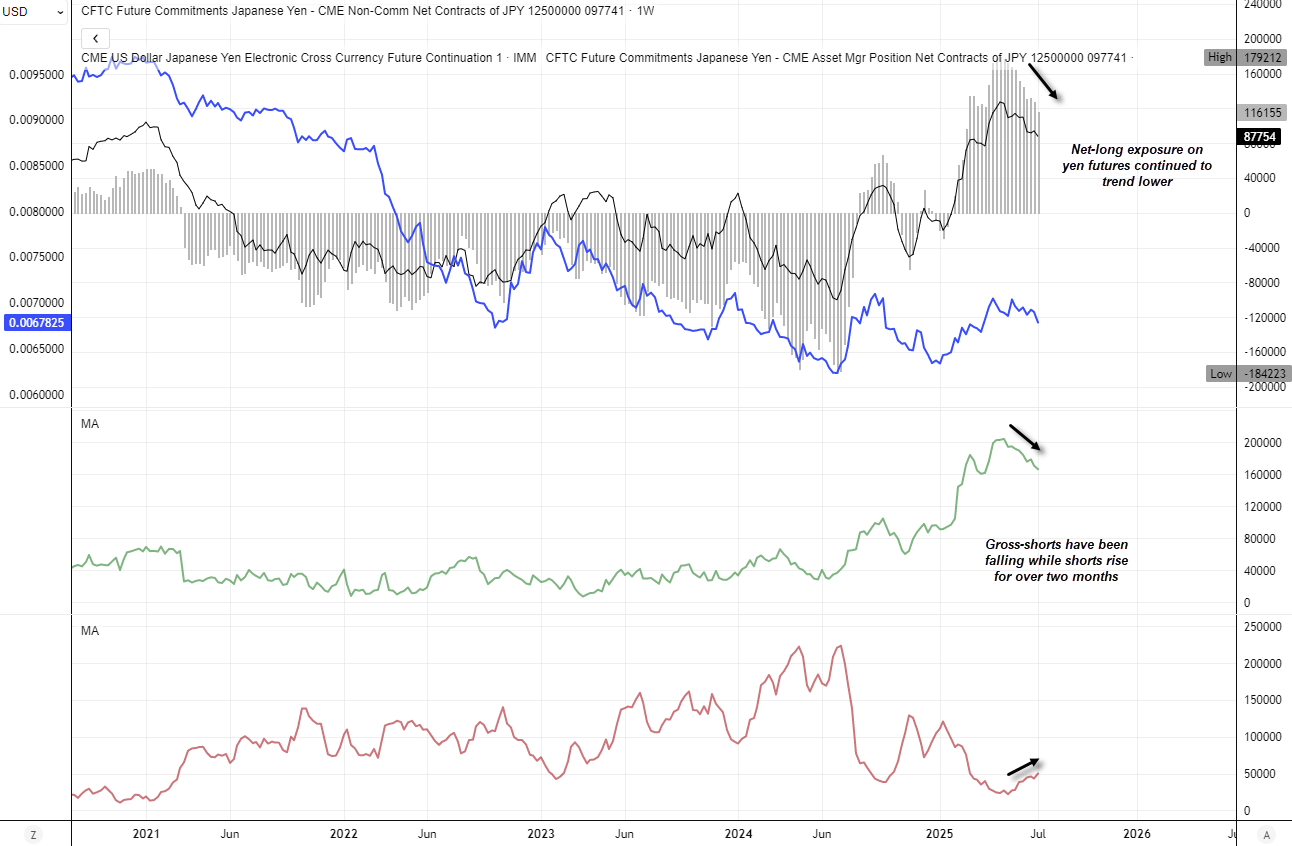
Chart prepared by Matt Simpson, data source: CME, London Stock Exchange Group (LSEG)
USD/JPY Technical Analysis: US Dollar vs Japanese Yen
The weekly chart (left) shows USD/JPY trading around the upper trendline of the aforementioned symmetrical triangle. A softer-than-expected CPI print could trigger a short-term pullback in USD/JPY, though any retracement may be limited given the strong bullish momentum that has driven the US dollar higher against the Japanese yen.
It appears that USD/JPY is intent on testing the December low near 148.65 or the key 149.00 handle. A decisive break above either level would likely shift focus to the psychological 150.00 barrier.
That said, the 200-day EMA at 147.91 sits just below and could offer initial support or resistance in the near term. Still, a break above 148.00 would bring the December low within reach. With the daily RSI (14) trending higher and not yet overbought—confirming rising prices—a bullish breakout remains the more probable scenario, especially in a backdrop of a weak Japanese yen and resilient US dollar.
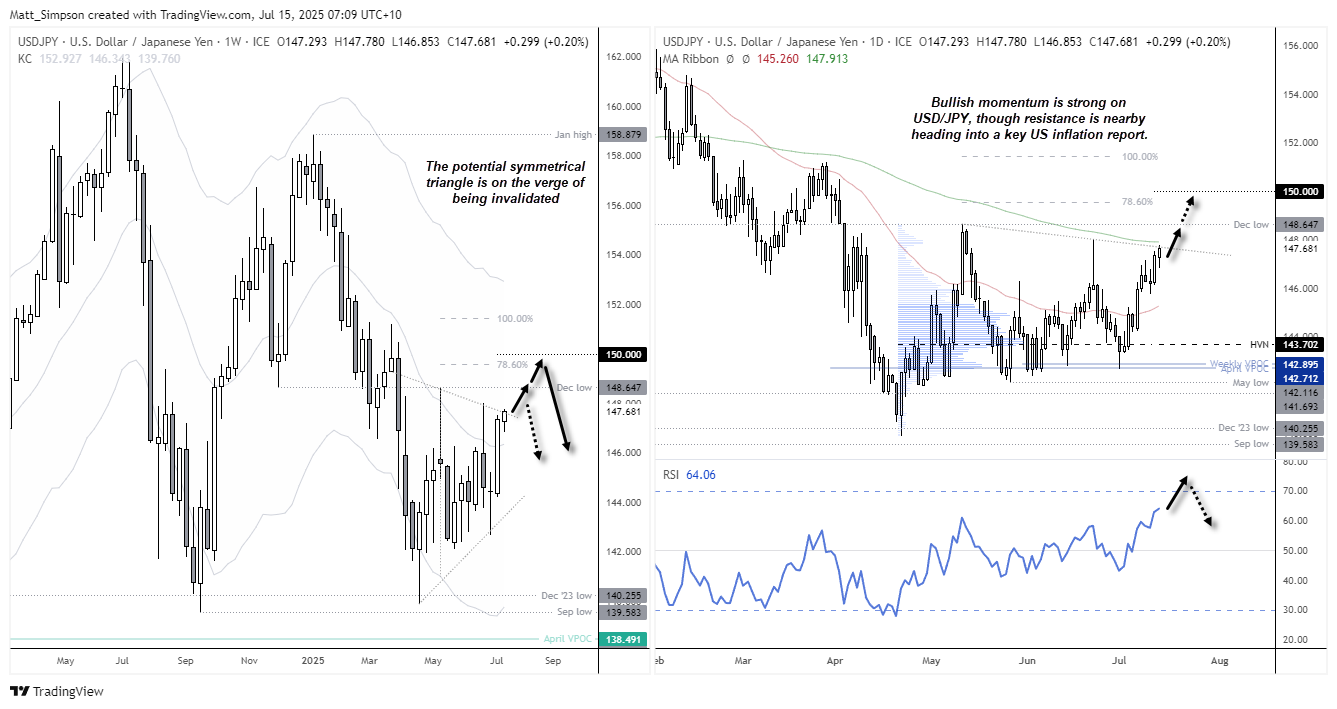
Chart analysis by Matt Simpson - data source: TradingView USD/JPY
Economic Events in Focus (AEST / GMT+10)
09:01 GBP BRC Retail Sales Monitor (YoY) (Jun) (GBP/USD, FTSE 100)
10:30 AUD Westpac Consumer Sentiment (Jul) (AUD/USD, ASX 200)
11:30 CNY House Prices (YoY) (Jun) (USD/CNH, Hang Seng Index, CSI 300)
12:00 CNY Fixed Asset Investment, GDP, Industrial Production, Retail Sales, Unemployment (Jun), NBS Press Conference (USD/CNH, Hang Seng Index, CSI 300)
17:00 EUR Core CPI (YoY), Spanish CPI (MoM & YoY), Spanish HICP (MoM & YoY) (Jun) (EUR/USD, DAX)
19:00 EUR German ZEW Current Conditions, German ZEW Economic Sentiment, Industrial Production (May), ZEW Economic Sentiment (Jul) (EUR/USD, DAX)
19:30 EUR German 2-Year Schatz Auction (EUR/USD, German Bonds)
20:00 EUR ECOFIN Meetings, Reserve Assets Total (Jun) (EUR/USD, DAX)
21:00 USD OPEC Monthly Report (Crude Oil, USD)
22:15 CAD Housing Starts (Jun) (USD/CAD, TSX)
22:30 USD Core CPI Real Earnings (Jun), NY Empire State Manufacturing Index (Jul) (USD, S&P 500, Nasdaq 100, Dow Jones, Gold, Crude Oil)
22:30 Core Manufacturing Sales (May), (USD/CAD, CAD/JPY, EUR/CAD, AUD/CAD, TSX)
22:55 USD Redbook (YoY) (USD, S&P 500)
23:15 USD FOMC Member Bowman Speaks (USD, US indices)
01:00 NZD GlobalDairyTrade Price Index (NZD/USD, NZX 50)
02:45 USD Fed Vice Chair for Supervision Barr Speaks (USD, US indices)
03:00 USD FOMC Member Barkin Speaks (USD, US indices)
04:45 USD Fed Collins Speaks (USD, US indices)
View the full economic calendar
View the full economic calendar
-- Written by Matt Simpson
Follow Matt on Twitter @cLeverEdge
How to trade with City Index
You can trade with City Index by following these four easy steps:
- Open an account, or log in if you’re already a customer
• Open an account in the UK
• Open an account in Australia
• Open an account in Singapore
- Search for the market you want to trade in our award-winning platform
- Choose your position and size, and your stop and limit levels
- Place the trade
Related tags:


Open an account in minutes
Experience award-winning platforms with fast and secure execution, and enjoy tight spreads from 0.5 pts on FX and 0.3 pts on indices.
Economic calendar
Web Trader platform
Our sophisticated web-based platform is packed with features.
Related articles

USD/JPY Weekly Outlook: AI earnings could overshadow the Fed and BoJ
AI sentiment has become a major driver of US Treasury yields and USD/JPY. With Microsoft, Alphabet and Amazon reporting this week, central bank decisions may have competition for traders' attention.


USD/JPY Forecast: Is Rising Japanese Inflation Supporting the Yen?
As the trading week comes to an end, one of the most relevant developments in the FX market has been the renewed strength of the Japanese yen. This can be seen in the recent performance of USD/JPY, which has fallen nearly 1.0% over the last two trading sessions, highlighting a meaningful recovery in the Japanese currency against the U.S. dollar.


US Dollar Price Action Setups: EUR/USD, USD/JPY, GBP/USD, USD/CAD
The Dollar is working on its second consecutive red week and while sellers didn’t exactly pounce on fresh lows, there’s an opening door for bears to make a move.

This report is intended for general circulation only. It should not be construed as a recommendation, or an offer (or solicitation of an offer) to buy or sell any financial products. The information provided does not take into account your specific investment objectives, financial situation or particular needs. Before you act on any recommendation that may be contained in this report, independent advice ought to be sought from a financial adviser regarding the suitability of the investment product, taking into account your specific investment objectives, financial situation or particular needs.
StoneX Financial Pte. Ltd., may distribute reports produced by its respective foreign entities or affiliates within the StoneX group of companies or third parties pursuant to an arrangement under Regulation 32C of the Financial Advisers Regulations. Where the report is distributed to a person in Singapore who is not an accredited investor, expert investor or an institutional investor (as defined in the Securities Futures Act), StoneX Financial Pte. Ltd. accepts legal responsibility to such persons for the contents of the report only to the extent required by law. Singapore recipients should contact StoneX Financial Pte. Ltd. at 6826 9988 for matters arising from, or in connection with the report.
In the case of all other recipients of this report, to the extent permitted by applicable laws and regulations neither StoneX Financial Pte. Ltd. nor its associated companies will be responsible or liable for any loss or damage incurred arising out of, or in connection with, any use of the information contained in this report and all such liability is hereby expressly disclaimed. No representation or warranty is made, express or implied, that the content of this report is complete or accurate.
StoneX Financial Pte. Ltd. is not under any obligation to update this report.
Trading CFDs carries a high level of risk that may not be suitable for some investors. Consider your investment objectives, level of experience, financial resources, risk appetite and other relevant circumstances carefully. The possibility exists that you could lose some or all of your investments, including your initial deposits. If in doubt, please seek independent expert advice. Visit www.forex.com/en-sg/terms-and-policies for the complete Risk Disclosure Statement.