


USD/JPY Outlook: Japanese Yen Dominates Amid Wall Street Selloff
The Japanese yen outperformed all majors as risk sentiment soured and Wall Street slumped, with USD/JPY slipping after a bearish outside day.
Share this:

The Japanese yen was the strongest FX major during a risk-off session on Tuesday, though the US dollar was not far behind. A sharp decline in Palantir’s stock despite a positive outlook, combined with warnings from the Goldman Sachs and Morgan Stanley CEOs that a pullback could be “healthy,” weighed heavily on Wall Street sentiment — ultimately prompting the very pullback they warned of.
Nasdaq 100 futures led Wall Street lower, falling 2% to a seven-day low in their worst session in more than three weeks. Palantir (PLTR) was the worst performer, dropping 9% from its record high and sliding below $200. The S&P 500 fell 1.1%, with eight of its 11 sectors declining, led by Information Technology (-2.5%) and Consumer Discretionary (-1.5%). The Philadelphia Semiconductor Index (SOX) dropped 3%, as traders grew concerned that the AI rally may be overextended.
While the yen was the preferred destination for risk-off flows among currency traders, the US dollar also regained some of its safe-haven appeal less than a week after the Fed delivered a relatively hawkish interest rate cut. Traders are also likely mindful of recent comments from Japan’s finance officials, who continue to watch the currency “very closely” in the hope that verbal intervention can stem volatility.
View related analysis:
View related analysis:
US Dollar Index (DXY) Technical Analysis
The US dollar index has closed above 100 for the first time in six months — though only slightly. The combination of a less-dovish Fed and safe-haven demand continues to shake dollar bears out of the tree, allowing the greenback to rise for a fifth consecutive day. My bias for a deeper wave C and a move closer to the May high remains in place, with the possibility of a rally towards the 138.2% Fibonacci extension near 101.50 still on the cards.
Still, the marginal close above 100, alongside a fifth-day high, could warrant at least some caution around current levels. However, momentum remains clearly behind the dollar’s bullish camp, and dips seem more likely to be bought than sold for now.
Once wave C is complete, I anticipate momentum will realign with the broader bearish move from the January high to the June low.

Chart analysis by Matt Simpson - data source: TradingView U.S. Dollar Index Futures


Japanese Yen (JPY) Technical Analysis
Yen pairs were lower across the board, even against the mighty US dollar. The performance of the major currencies against the yen serves as a useful lesson in relative strength.
- The New Zealand dollar led the declines, with NZD/JPY falling 1.3% in its worst session in 17 days. The RBNZ retains a dovish bias, making the Kiwi dollar more sensitive to risk-off flows than usual. The cross printed a firm daily close beneath its 200-day EMA — a level bears may look to fade into should it be retested.
- The Australian dollar could have fallen further were it not for the relatively hawkish RBA meeting on Tuesday, where policymakers held rates as expected and trimmed their forecasts to allow for just one 25 bp cut in 2026. AUD/JPY fell 1.1% and closed back below 100, though support has been found around its 20-day EMA for now.
- The Swiss franc weakened against the yen for a third straight day, with CHF/JPY dropping below 190 and extending its decline from the record high to 1.7%.
- A bearish outside day formed on USD/JPY as the yen found slightly more appeal than the US dollar for safe-haven flows. However, its broader bullish trend remains intact and could still attract dip-buyers.
- EUR/JPY fell beneath its prior swing low on the daily chart, warning of a potential trend change — or at least the start of a three-wave corrective move, of which this would presumably be the first wave. That said, it appears to be attempting a recovery back above the 20-day EMA in the near term.
- GBP/JPY saw a firm daily close beneath its 50-day EMA — a level bears could look to fade into should it retrace far enough.

Chart analysis by Matt Simpson - data source: TradingView


USD/JPY Technical Analysis: US Dollar vs Japanese Yen
The bearish outside day on USD/JPY has spoiled the bullish trend over the near term, though not yet reversed it — for that, prices would need to break below the 151.53 swing low. Still, USD/JPY appears stretched from its 10- and 20-day EMAs, while a bearish divergence has formed on the daily RSI (2), suggesting some mean reversion could be due.
The October high at 153.28 is likely a pivotal level for traders in the short term, made more significant by its alignment with the weekly pivot point. The 1-hour chart shows prices attempting to hold above that level for now.
The bias is for a break beneath the October low once the current consolidation or retracement on the 1-hour timeframe completes. Bears may look to fade into moves toward the 154 handle or high-volume node in anticipation of a pullback to the 20-day EMA near 152.
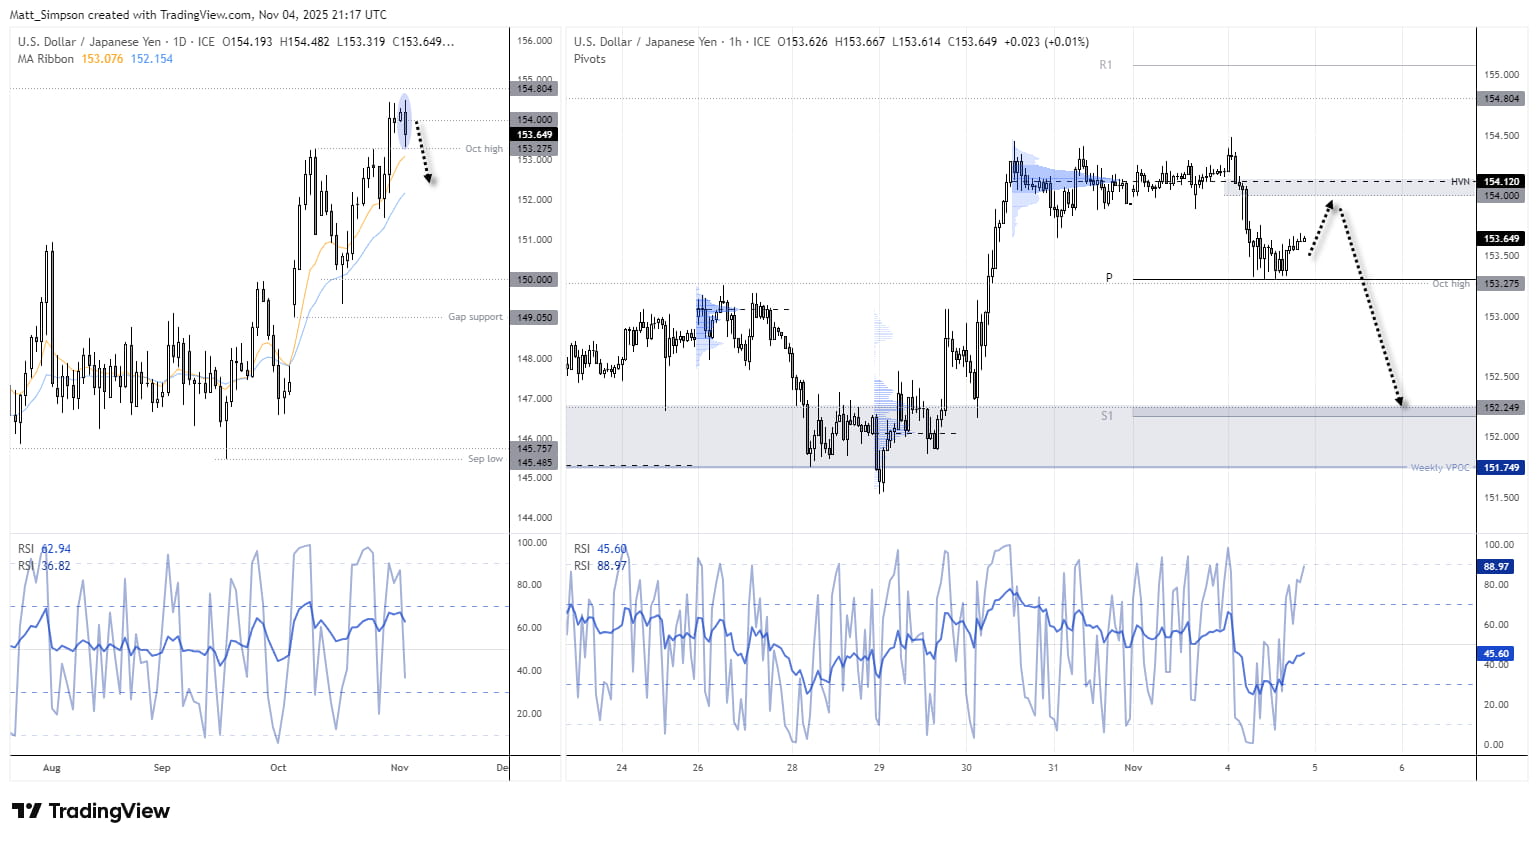
Chart analysis by Matt Simpson - data source: TradingView USD/JPY
View the full economic calendar
View the full economic calendar
-- Written by Matt Simpson
Follow Matt on Twitter @cLeverEdge
How to trade with City Index
You can trade with City Index by following these four easy steps:
- Open an account, or log in if you’re already a customer
• Open an account in the UK
• Open an account in Australia
• Open an account in Singapore
- Search for the market you want to trade in our award-winning platform
- Choose your position and size, and your stop and limit levels
- Place the trade
Related tags:



Open an account in minutes
Experience award-winning platforms with fast and secure execution, and enjoy tight spreads from 0.5 pts on FX and 0.3 pts on indices.
Economic calendar
Web Trader platform
Our sophisticated web-based platform is packed with features.
Related articles
Australian Dollar Outlook: AUD/USD Screams Sentiment Extreme Into Fed, CPI
AUD/USD rebounds despite record bearish futures positioning, with Australian Q3 CPI and the Fed meeting threatening to trigger another short squeeze.

EUR/USD weekly outlook: FOMC and ECB to set the tone
The current backdrop is modestly bearish. On Friday, the EUR/USD closed modestly lower, down for the third consecutive day. The pair also posted a weekly decline after staging a modest recovery attempt in the previous week. Out of the past 8 weeks, the EUR/USD has fallen on 6 occasions. There is not much supporting factors for the single currency right now. So, the upside remains capped.


USD/JPY Weekly Outlook: AI earnings could overshadow the Fed and BoJ
AI sentiment has become a major driver of US Treasury yields and USD/JPY. With Microsoft, Alphabet and Amazon reporting this week, central bank decisions may have competition for traders' attention.

This report is intended for general circulation only. It should not be construed as a recommendation, or an offer (or solicitation of an offer) to buy or sell any financial products. The information provided does not take into account your specific investment objectives, financial situation or particular needs. Before you act on any recommendation that may be contained in this report, independent advice ought to be sought from a financial adviser regarding the suitability of the investment product, taking into account your specific investment objectives, financial situation or particular needs.
StoneX Financial Pte. Ltd., may distribute reports produced by its respective foreign entities or affiliates within the StoneX group of companies or third parties pursuant to an arrangement under Regulation 32C of the Financial Advisers Regulations. Where the report is distributed to a person in Singapore who is not an accredited investor, expert investor or an institutional investor (as defined in the Securities Futures Act), StoneX Financial Pte. Ltd. accepts legal responsibility to such persons for the contents of the report only to the extent required by law. Singapore recipients should contact StoneX Financial Pte. Ltd. at 6826 9988 for matters arising from, or in connection with the report.
In the case of all other recipients of this report, to the extent permitted by applicable laws and regulations neither StoneX Financial Pte. Ltd. nor its associated companies will be responsible or liable for any loss or damage incurred arising out of, or in connection with, any use of the information contained in this report and all such liability is hereby expressly disclaimed. No representation or warranty is made, express or implied, that the content of this report is complete or accurate.
StoneX Financial Pte. Ltd. is not under any obligation to update this report.
Trading CFDs carries a high level of risk that may not be suitable for some investors. Consider your investment objectives, level of experience, financial resources, risk appetite and other relevant circumstances carefully. The possibility exists that you could lose some or all of your investments, including your initial deposits. If in doubt, please seek independent expert advice. Visit www.forex.com/en-sg/terms-and-policies for the complete Risk Disclosure Statement.