


Wall Street Futures Feel the Heat of Crude Oil Surge
Wall Street futures fall as crude oil surges on escalating Middle East tensions, raising fears of supply disruption and a broader hit to global growth.
Share this:

Wall Street futures are under pressure after crude oil surged at the weekly open, as escalating Middle East tensions drive volatility across global markets. With oil prices spiking and equities testing key support levels, traders are bracing for further risk-off moves.
View related analysis:
View related analysis:
Wall Street Futures Feel the Heat of Crude Oil Surge
It has been another volatile start to the week as traders catch up with weekend news flows. Middle East tensions escalated further after Iran named Mojtaba Khamenei as its new supreme leader, while reports highlighted deep divisions within Iran’s leadership. Gulf states also hardened their stance, with Saudi Arabia warning it could respond militarily if attacks continue and the UAE signalling it may take “all necessary measures” to defend itself.
At the same time, the conflict is expanding beyond Israel and Iran. Hezbollah – an Iran-backed militia based in Lebanon – has opened a second front against Israel, firing rockets from southern Lebanon. Israel has responded with strikes across Lebanon, meaning it is now effectively fighting on two fronts.
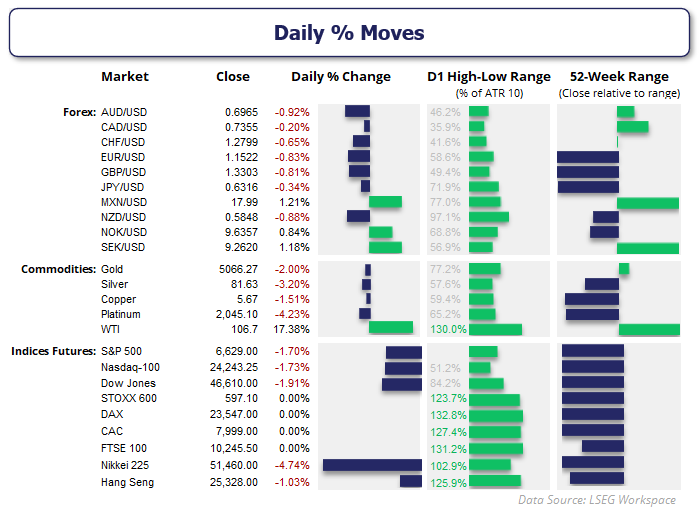
For markets, the concern is that a broader regional war could threaten oil infrastructure and shipping routes across the Gulf. Even the risk of disruption to key supply routes such as the Strait of Hormuz, through which around a fifth of global oil flows, is enough to push crude sharply higher as traders price in a growing geopolitical risk premium.
Source: LSEG


Crude Oil explodes higher as Middle East turmoil deepens
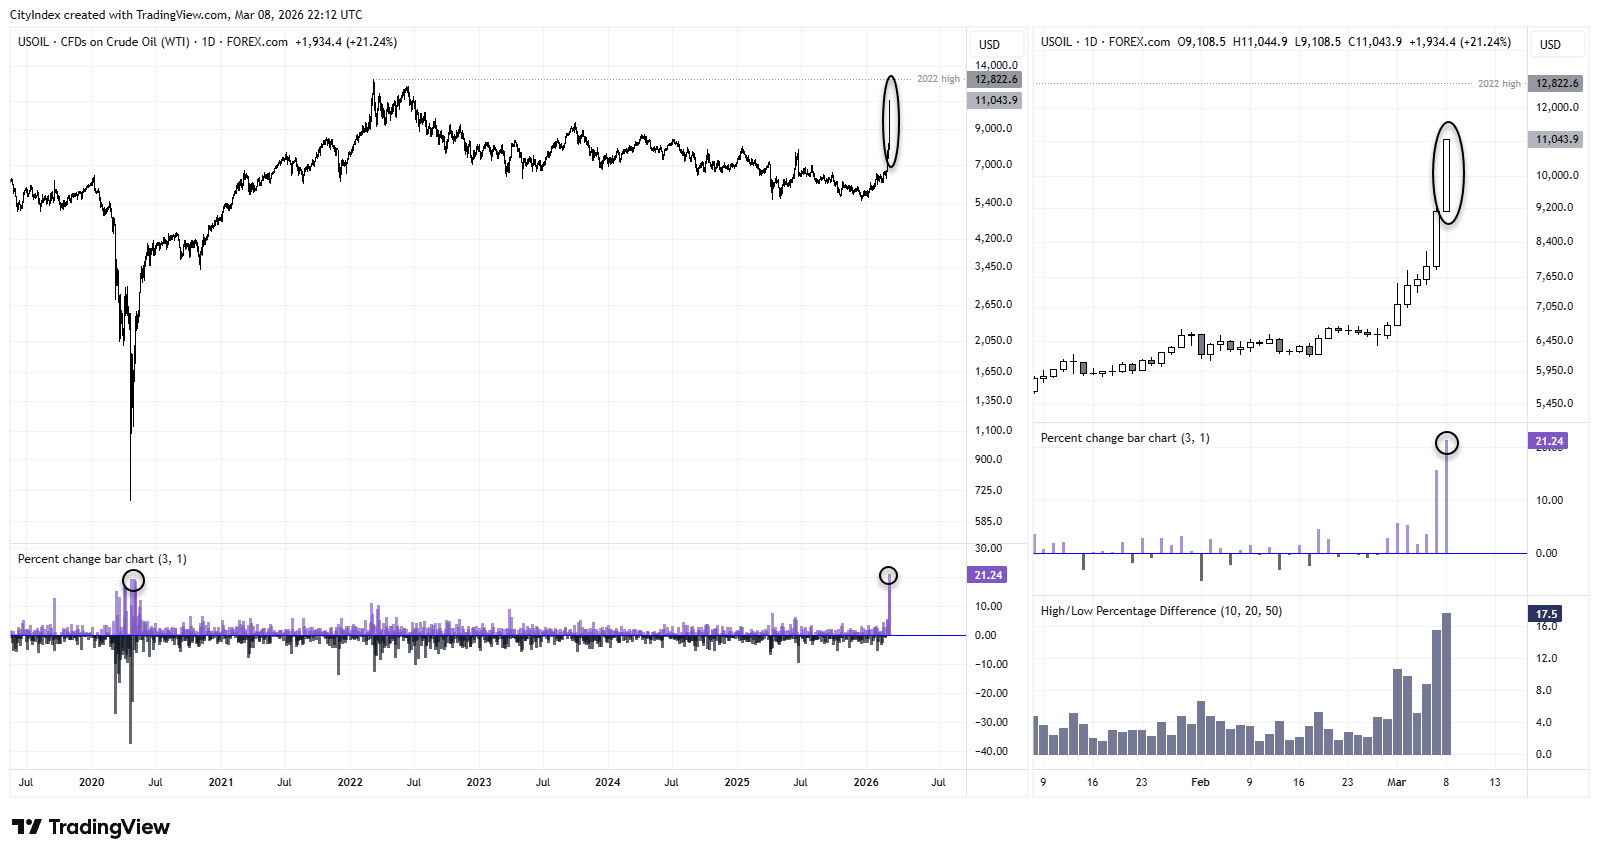
Crude oil prices exploded higher out of the gate, with WTI surging more than 20% within minutes of the weekly open. Clearly, its 35% rally last week was not enough to fully price in the turmoil in the Middle East.
And when you consider this surge has occurred around $100 — and is on track to exceed the daily moves seen during the rebound from the 2020 lows (when futures briefly went negative) — it makes the move all the more impressive, if somewhat concerning.
Source: Forex.com, TradingView
Dow leads Wall Street lower as risk sentiment deteriorates
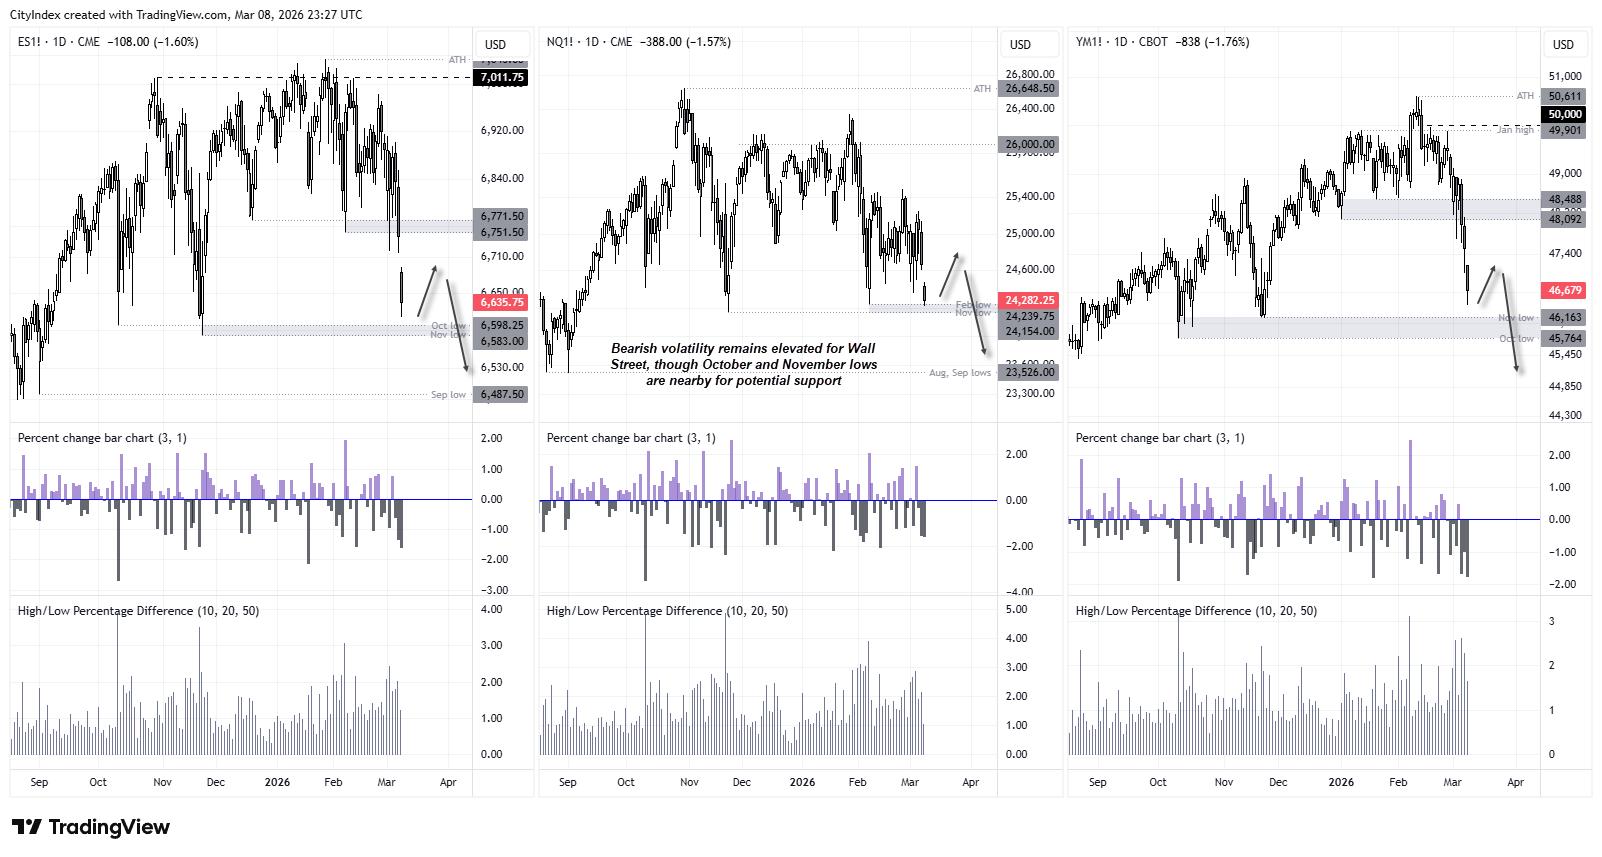
Wall Street futures have gapped lower, with the Dow Jones leading the declines, currently down -1.8% from Friday’s close. I warned that it could be the underperformer relative to its Wall Street peers, given it printed a shooting star candle in February and has generally struggled to build momentum since December.

Source: CME, CBOT, TradingView
- The Dow Jones Industrial Average touched a daily low of -8.3% from its all-time high, just above 50,000.
- The S&P 500 is down -1.5% and fast approaching its October and November lows.
- The Nasdaq 100 has threatened a break of its February low, although the November low could provide support.
While this may tempt some bears to chase the move lower, caution may be warranted given that all three indices are hovering just above key support levels. Unless we see immediate follow-through to the downside, the odds likely favour at least a pause for breath or a mild bounce.
But if tensions continue to escalate and oil prices keep surging, Wall Street traders may be forced to take greater notice. Oil remains the lubricant of the global economy, and sustained price spikes tend to act as a tax on growth. If supply disruptions intensify and energy prices remain elevated, it could slow economic activity, squeeze consumers and increase the risk that traders begin pricing in a broader global slowdown.


Oil, Gold and Equities React to Geopolitical Shock
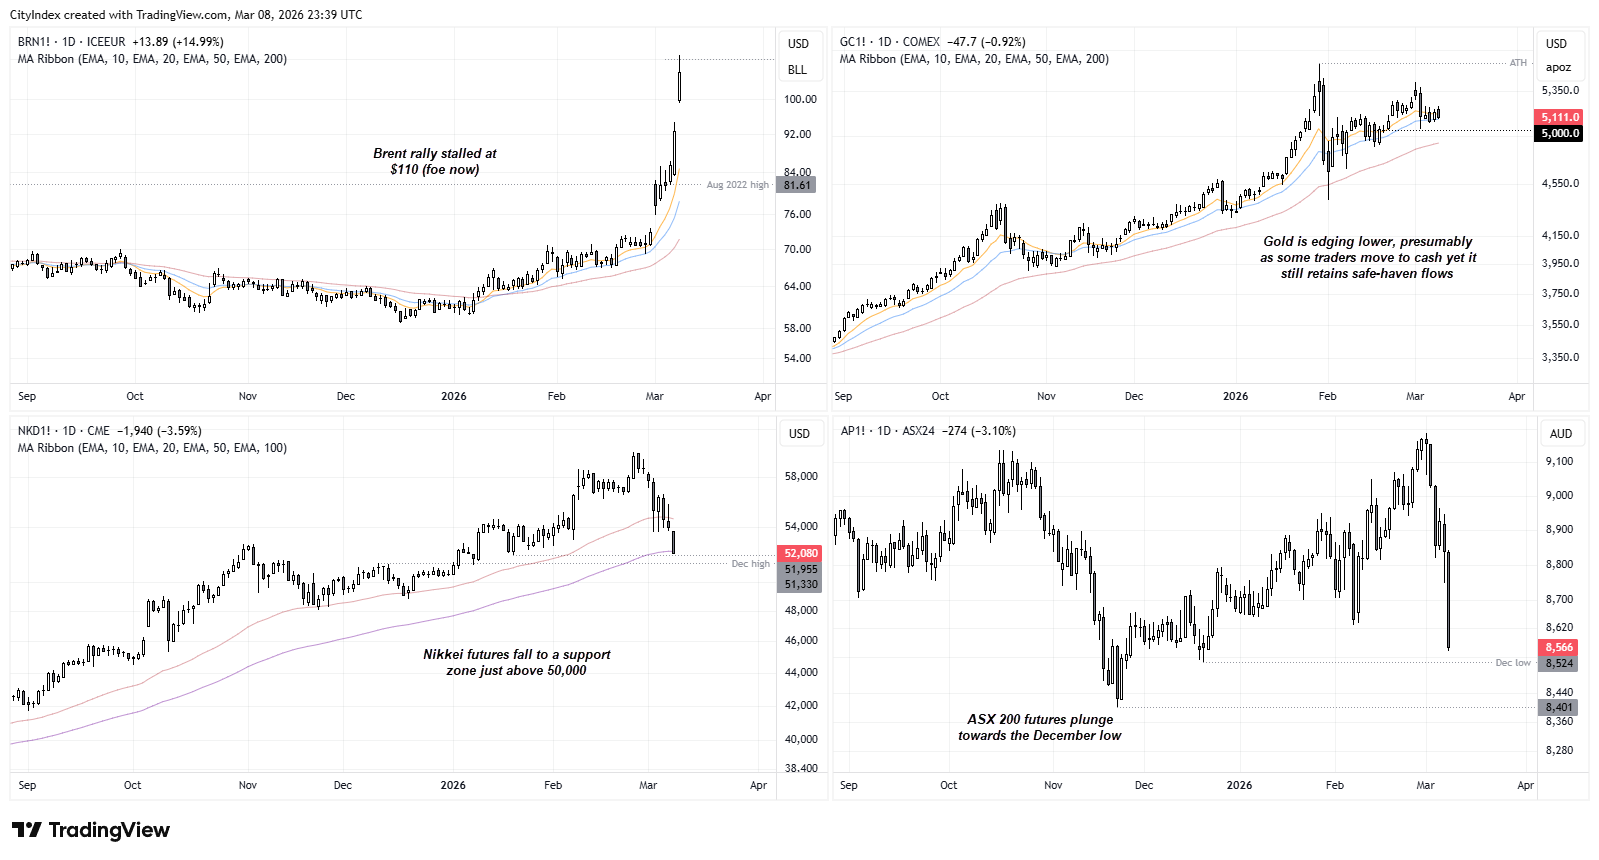
Crude oil prices are now pulling back from their early-week highs, with Brent futures back below $110. Gold has erased most of Friday’s gains, although volatility remains contained relative to crude oil. While logic might suggest gold should be higher, it often falls during explosive moves in equities as some traders move to cash or close gold positions to nurse losses elsewhere.
The sell-off on Wall Street has also not been limited to the US, with Nikkei futures down -3.6% at the time of writing and testing their 100-day EMA. The December high and January low also sit in this area, just above 50,000, making it a pivotal zone for traders today and potentially for the week.
SPI 200 (ASX futures) have also plunged more than 3%, taking losses from their all-time high to -6.7%. Yet again, a nearby swing low could provide a pause in the move.
As hinted previously, chasing these volatile moves when they are so close to support levels risks joining the party late. Bears may instead want to monitor indices in tandem for signs of a mild rebound, which could improve the reward-to-risk profile for downside trades ahead of a potential break of key support levels. The alternative is simply to wait for a confirmed break.
Ultimately, the only way we are likely to see a strong rebound in risk assets is if some form of truce emerges. And that seems unlikely for now, given Iran has just installed its new leader, who is unlikely to want to play nicely with the US or its neighbours.
Source: ICE, COMEX, CME, ASX24, TradingView
View the full economic calendar
View the full economic calendar
-- Written by Matt Simpson
Follow Matt on Twitter @cLeverEdge
How to trade with City Index
You can trade with City Index by following these four easy steps:
- Open an account, or log in if you’re already a customer
• Open an account in the UK
• Open an account in Australia
• Open an account in Singapore
- Search for the market you want to trade in our award-winning platform
- Choose your position and size, and your stop and limit levels
- Place the trade




Open an account in minutes
Experience award-winning platforms with fast and secure execution, and enjoy tight spreads from 0.5 pts on FX and 0.3 pts on indices.
Economic calendar
Web Trader platform
Our sophisticated web-based platform is packed with features.
Related articles

Crude Oil Forecast: Weekend Iran Strike Fears Lift Oil Toward War Highs
Brent crude oil is accelerating above $110 as traders price in the risk of a US-Israeli strike on Iran over the weekend. How much more of a geopolitical premium can oil build in before the close?


S&P 500 forecast: AI linked stocks remain under pressure
And just like that, it is Friday again and the end of a volatile week. Today offers little on the macro calendar to change the prevailing narrative, leaving markets largely at the mercy of risk appetite, oil prices and the growing unease around the AI trade.


Copper Tests 14-Month Support
Copper technical analysis shows prices pulling back from multi-year resistance alongside gold and silver, towards a 14-month uptrend support.

This report is intended for general circulation only. It should not be construed as a recommendation, or an offer (or solicitation of an offer) to buy or sell any financial products. The information provided does not take into account your specific investment objectives, financial situation or particular needs. Before you act on any recommendation that may be contained in this report, independent advice ought to be sought from a financial adviser regarding the suitability of the investment product, taking into account your specific investment objectives, financial situation or particular needs.
StoneX Financial Pte. Ltd., may distribute reports produced by its respective foreign entities or affiliates within the StoneX group of companies or third parties pursuant to an arrangement under Regulation 32C of the Financial Advisers Regulations. Where the report is distributed to a person in Singapore who is not an accredited investor, expert investor or an institutional investor (as defined in the Securities Futures Act), StoneX Financial Pte. Ltd. accepts legal responsibility to such persons for the contents of the report only to the extent required by law. Singapore recipients should contact StoneX Financial Pte. Ltd. at 6826 9988 for matters arising from, or in connection with the report.
In the case of all other recipients of this report, to the extent permitted by applicable laws and regulations neither StoneX Financial Pte. Ltd. nor its associated companies will be responsible or liable for any loss or damage incurred arising out of, or in connection with, any use of the information contained in this report and all such liability is hereby expressly disclaimed. No representation or warranty is made, express or implied, that the content of this report is complete or accurate.
StoneX Financial Pte. Ltd. is not under any obligation to update this report.
Trading CFDs carries a high level of risk that may not be suitable for some investors. Consider your investment objectives, level of experience, financial resources, risk appetite and other relevant circumstances carefully. The possibility exists that you could lose some or all of your investments, including your initial deposits. If in doubt, please seek independent expert advice. Visit www.forex.com/en-sg/terms-and-policies for the complete Risk Disclosure Statement.