


AUD/JPY Rattled at 35-Year High, Gold Probes 5000 as Volatility Spikes
Global markets swung sharply as war headlines fuelled volatility. AUD/JPY hit a 35-year high, gold probed 5,000 and equity indices suffered heavy losses.
Share this:

Volatility remained elevated on Tuesday as a wave of Middle East headlines rattled global markets. Equity indices and precious metals both closed lower, while currency markets endured wide intraday swings. Gold briefly probed the 5,000 level and AUD/JPY reached a fresh 35-year high, highlighting the extreme cross-asset volatility dominating trading conditions.
View related analysis:
View related analysis:


AUD/JPY Hits 35-Year High While Gold Tests 5,000 Amid Market Volatility
Volatility remained elevated on Tuesday amid a flurry of Middle East headlines, though the tone leaned bearish, with stock indices and precious metals both closing lower.
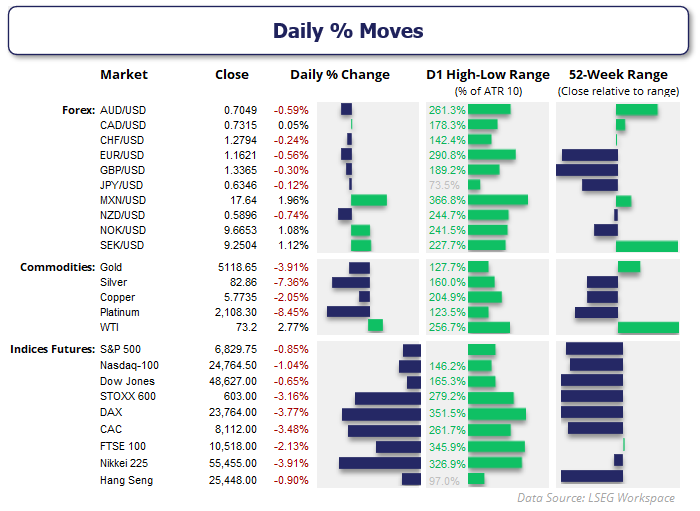
While Monday’s volatility was largely confined to the opening minutes of the week as traders priced in weekend news, Tuesday proved to be a more drawn-out affair. Most major markets endured daily ranges of two to three times their usual ATRs (average true ranges).
Gold falling alongside equities suggests it was a genuine risk-off session, as traders were likely forced to liquidate holdings to cover losses in equity markets or simply chose to move to cash and flatten positions for the day.
Source: LSEG
Markets Swing as Volatility Surges Across FX, Indices and Commodities
- European indices stood out for their volatility, with the DAX and FTSE 100 posting daily ranges of around 350% of their 10-day ATR, closing -3.2% and -2.1% respectively.
- Nasdaq 100 futures led the S&P 500 and Dow Jones lower, though all managed to recoup around half of the day’s losses and close back above key support levels, denying bears a clean breakout.
- SPI 200 (ASX 200 futures) fell as much as -3.4% overnight and closed down -1.4%, suggesting a notable gap lower for the ASX cash market today.
- NZD/USD and AUD/USD were the weakest FX majors, though their declines of -0.7% and -0.6% respectively mask the true volatility of the session, with ranges of around 250% of their ATRs.
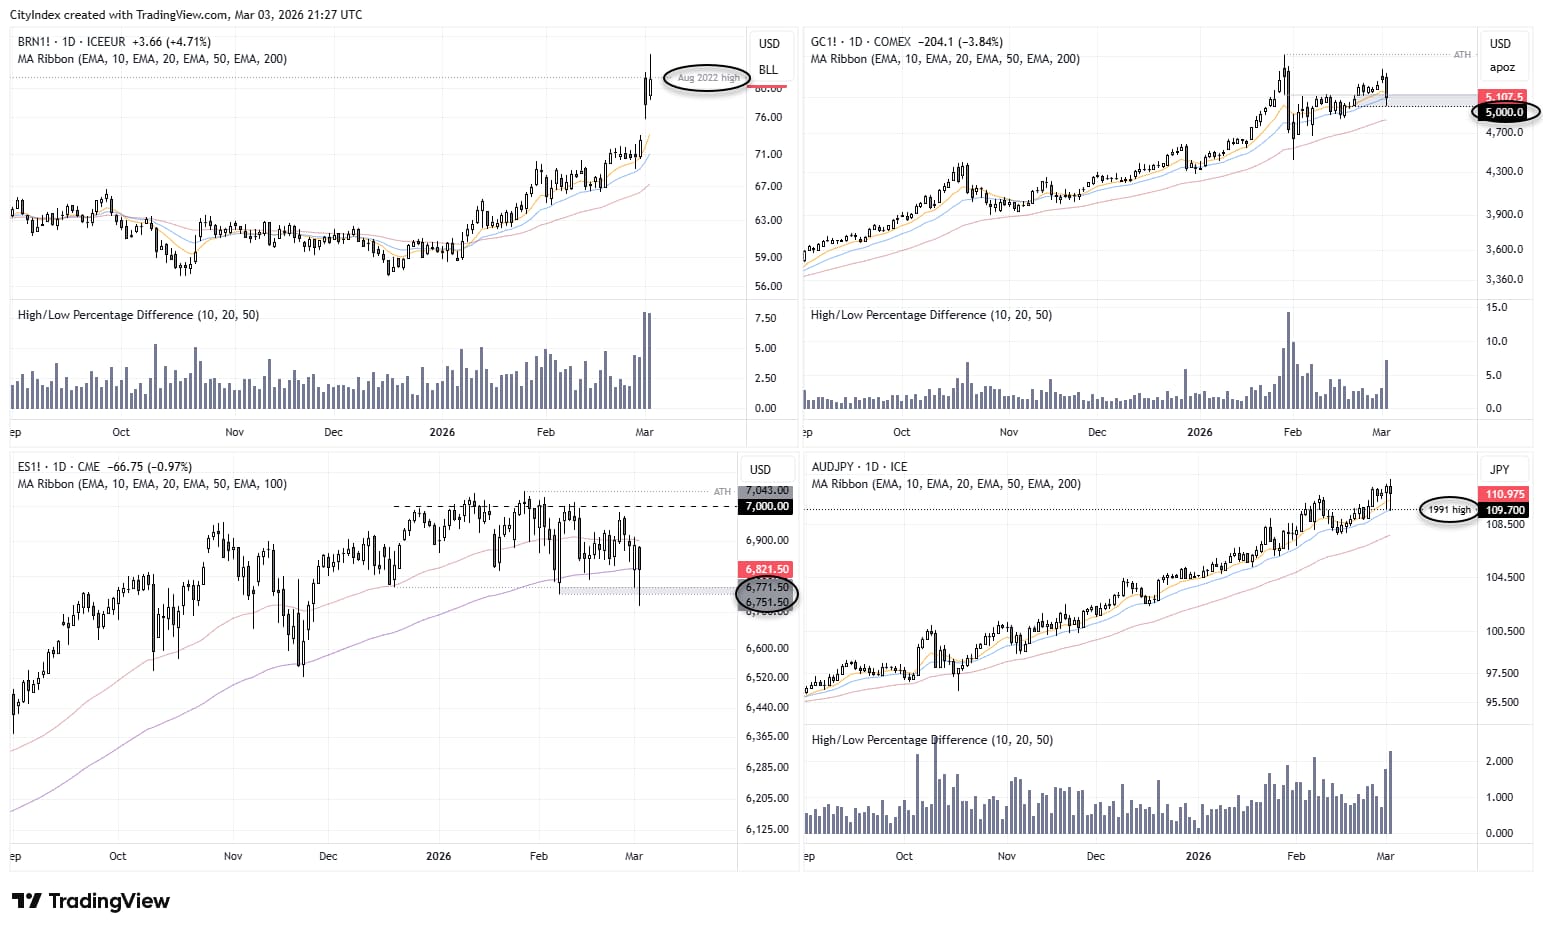
- AUD/JPY formed an elongated hanging man candle despite reaching a 35-year high following hawkish comments from RBA Governor Bullock, with the 1991 high clearly acting as a pivotal level for traders.
- Crude oil rose 4.7% by the daily close, though it had earlier surged as much as 7.7% intraday before finishing just beneath Monday’s open and the August 2022 high.
- Gold fell in line with my near-term bearish bias, though it overshot my downside target of 5,200 and probed 5,000 — likely a pivotal level for traders this week.
Source: ICE, COMEX, CME, TradingView
FX Volatility Surges but Widespread Wicks Signal Indecision
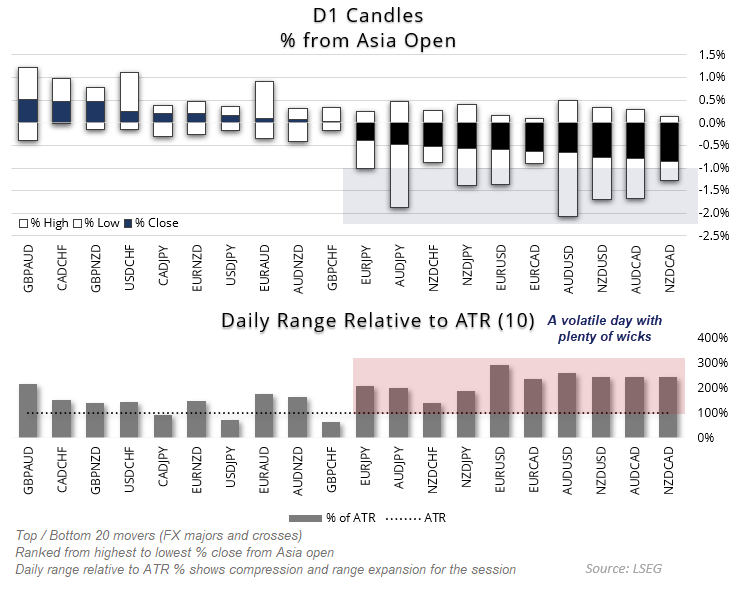
Currency markets, in particular, reflected a day of volatile indecision. Daily ranges clearly expanded, with several euro pairs pushing beyond 200% of their 10-day ATR and EUR/USD approaching 300%, yet forex pairs were also littered with large upper and lower wicks. This shows reversals occurred near the session’s extremes, with many pairs retracing at least two-thirds of the prior move before the close.
Source: LSEG
A true risk-off session would typically see markets open near their highs and close near their lows. Instead, volatility was accompanied by indecision. That does little to simplify today’s directional outlook, but it should keep traders alert.
My base case for now is that currency markets could trade largely within Tuesday’s ranges — somewhere within the dominant wick structure and around Tuesday’s closing levels.
Much will depend on incoming headlines. Volatility could easily flare again during the European or US sessions, potentially forcing markets to choose a direction depending on whether geopolitical tensions escalate (risk-off) or ease (risk-on).


Economic Events in Focus (AEDT / GMT+11)
It is debatable how important today’s economic calendar will prove, despite being regionally packed. Traders clearly have the fog of war on their radar, alongside concerns that rising energy prices could fuel inflation while weighing on growth. In such an environment, strong economic data may simply reinforce expectations for tighter policy even as petrol prices climb.
Ultimately, traders — like any warm-blooded human — would prefer to see a swift resolution to the conflict in Iran.
That said, the RBA will be keeping a close eye on today’s Australian GDP figures, which may have scope to surprise higher given relatively low expectations. Final PMI readings are also due, which rarely move markets materially but still provide a useful temperature check on growth momentum and inflation trends.
That latter point makes the ISM non-manufacturing (services) PMI particularly important, especially after the sharp rise in prices paid seen in this week’s ISM manufacturing survey.
- 08:45 — NZD Terms of Trade, Export Prices, Import Prices, Export Volumes, Terms of Trade Index (Q4) (NZD/USD, AUD/NZD, NZD/JPY)
- 09:00 — AUD AiG Construction Index, AiG Manufacturing Index, S&P Global Manufacturing & Services PMI (Feb) (AUD/USD, AUD/JPY, AUD/NZD)
- 11:30 — AUD GDP, GDP Final Consumption, GDP Chain Price Index, GDP Capital Expenditure (Q4) (AUD/USD, AUD/JPY, AUD/NZD)
- 11:30 — JPY S&P Global Services PMI, Composite PMI (Feb) (USD/JPY, EUR/JPY, AUD/JPY)
- 12:30 — CNY Manufacturing PMI, Non-Manufacturing PMI, Composite PMI (Feb) (AUD/USD, AUD/CNH, USD/CNH)
- 12:45 — CNY Caixin Manufacturing PMI, Caixin Services PMI (Feb) (AUD/USD, AUD/CNH, USD/CNH)
- 16:00 — JPY Household Confidence (Feb) (USD/JPY, EUR/JPY, AUD/JPY)
- 18:30 — CHF CPI (Feb) (USD/CHF, EUR/CHF, GBP/CHF)
- 19:55 — EUR Germany Services PMI, Germany Composite PMI (Feb) (EUR/USD, EUR/GBP, EUR/JPY)
- 20:30 — GBP S&P Global Services PMI, Composite PMI (Feb) (GBP/USD, EUR/GBP, GBP/JPY)
- Thursday, March 5
- 00:15 — USD ADP Nonfarm Employment Change (Feb) (EUR/USD, USD/JPY, GBP/USD)
- 01:30 — CAD S&P Global Services PMI (Feb) (USD/CAD, CAD/JPY, EUR/CAD)
- 01:45 — USD S&P Global Services PMI, Composite PMI (Feb) (EUR/USD, USD/JPY, GBP/USD)
- 02:00 — USD ISM Non-Manufacturing PMI, Prices, Employment, New Orders, Business Activity (Feb) (EUR/USD, USD/JPY, GBP/USD)
View the full economic calendar
View the full economic calendar
-- Written by Matt Simpson
Follow Matt on Twitter @cLeverEdge
How to trade with City Index
You can trade with City Index by following these four easy steps:
- Open an account, or log in if you’re already a customer
• Open an account in the UK
• Open an account in Australia
• Open an account in Singapore
- Search for the market you want to trade in our award-winning platform
- Choose your position and size, and your stop and limit levels
- Place the trade
Related tags:




Open an account in minutes
Experience award-winning platforms with fast and secure execution, and enjoy tight spreads from 0.5 pts on FX and 0.3 pts on indices.
Economic calendar
Web Trader platform
Our sophisticated web-based platform is packed with features.
Related articles
Australian Dollar Outlook: AUD/USD Screams Sentiment Extreme Into Fed, CPI
AUD/USD rebounds despite record bearish futures positioning, with Australian Q3 CPI and the Fed meeting threatening to trigger another short squeeze.

Crude Oil Forecast: Weekend Iran Strike Fears Lift Oil Toward War Highs
Brent crude oil is accelerating above $110 as traders price in the risk of a US-Israeli strike on Iran over the weekend. How much more of a geopolitical premium can oil build in before the close?


Copper Tests 14-Month Support
Copper technical analysis shows prices pulling back from multi-year resistance alongside gold and silver, towards a 14-month uptrend support.

This report is intended for general circulation only. It should not be construed as a recommendation, or an offer (or solicitation of an offer) to buy or sell any financial products. The information provided does not take into account your specific investment objectives, financial situation or particular needs. Before you act on any recommendation that may be contained in this report, independent advice ought to be sought from a financial adviser regarding the suitability of the investment product, taking into account your specific investment objectives, financial situation or particular needs.
StoneX Financial Pte. Ltd., may distribute reports produced by its respective foreign entities or affiliates within the StoneX group of companies or third parties pursuant to an arrangement under Regulation 32C of the Financial Advisers Regulations. Where the report is distributed to a person in Singapore who is not an accredited investor, expert investor or an institutional investor (as defined in the Securities Futures Act), StoneX Financial Pte. Ltd. accepts legal responsibility to such persons for the contents of the report only to the extent required by law. Singapore recipients should contact StoneX Financial Pte. Ltd. at 6826 9988 for matters arising from, or in connection with the report.
In the case of all other recipients of this report, to the extent permitted by applicable laws and regulations neither StoneX Financial Pte. Ltd. nor its associated companies will be responsible or liable for any loss or damage incurred arising out of, or in connection with, any use of the information contained in this report and all such liability is hereby expressly disclaimed. No representation or warranty is made, express or implied, that the content of this report is complete or accurate.
StoneX Financial Pte. Ltd. is not under any obligation to update this report.
Trading CFDs carries a high level of risk that may not be suitable for some investors. Consider your investment objectives, level of experience, financial resources, risk appetite and other relevant circumstances carefully. The possibility exists that you could lose some or all of your investments, including your initial deposits. If in doubt, please seek independent expert advice. Visit www.forex.com/en-sg/terms-and-policies for the complete Risk Disclosure Statement.