



WTI and Dow Fall as Nasdaq Holds Its Bullish Rebound
WTI, Dow and Nasdaq Outlook: Crude oil oversupply risks, Fed rate-hike expectations, persistent geopolitical tensions and renewed interest in AI are driving market swings this week. Here are the key levels and scenarios to watch.
Share this:
The US–Iran war, now ongoing for nearly nine months, continues to affect company valuations, central-bank policy decisions, crude oil prices and Treasury yields.
In his latest remarks, Fed Governor Christopher Waller emphasized the case for a 50-basis-point rate hike at the December FOMC meeting, amid a sharp rise in US living costs and inflation remaining above 3%.
Against this backdrop, the US Dollar Index (DXY) approached 104, silver neared 44, and gold approached 3,690. The Nasdaq and S&P 500 revisited their November lows, while the Dow Jones recorded new monthly lows near 49,900.
- Latest analysis on Gold, Silver: US Dollar, Gold, Silver Outlook: 2026 Extremes and Key Levels to Watch
- Latest analysis on currencies: EUR/USD Tests 18-Year Support, Raising Potential Reversal Risks Across USD/JPY and GBP/USD
Despite the sharp moves in both price and momentum, several markets are approaching key confluence zones. This leaves room for short-term trend continuation as well as longer-term reversal risks. In crude oil, the International Energy Agency’s latest report flagged oversupply risks, adding to downward pressure on prices and possibly relieving inflation concerns.
Crude oil weekly outlook: Crude Oil Weekly Outlook: Geopolitics vs Oversupply Risks
WTI Crude Oil Outlook: Daily Time Frame — Log Scale
Source: Trading View
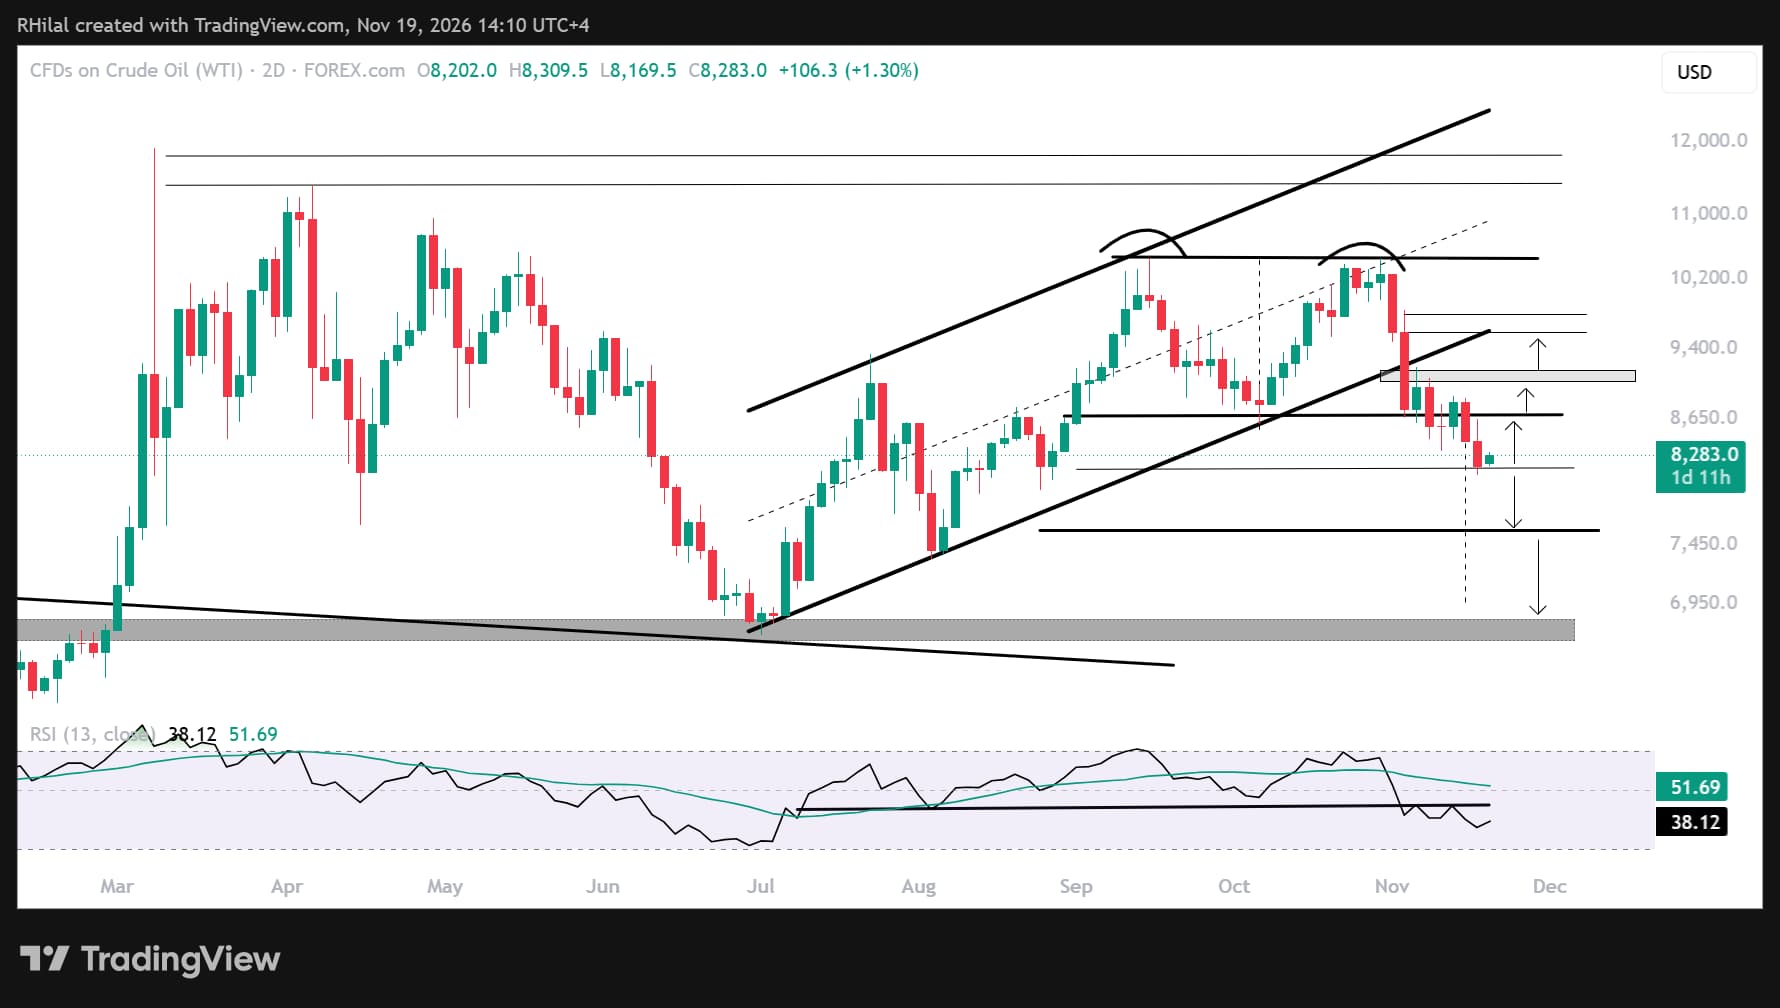
Despite ongoing tanker attacks and widespread cybersecurity concerns related to the US–Iran war, WTI crude oil may have further downside after closing below the psychological $80 level.
WTI may be tracing the measured target of a double-top pattern, after rejecting $104.50 resistance twice between September and October 2026. A confirmed close below $80 could extend downside risks toward $76, $73 and $68, respectively, bringing prices closer to pre-war levels. However, a clearer sign of geopolitical de-escalation or resilient crude supply would be needed to support that scenario.
On the upside, bullish risks remain as long as the war continues and shipping disruptions persist, despite the balance between recovering production and expectations of softer demand. A close above $87, the neckline of the double top and a level currently reinforcing the bearish setup, would revive near-term bullish continuation risks toward $92 and $97. A sustained move higher would be needed to confirm a longer-term bullish outlook and bring the boundaries of the July–November uptrend channel into focus, potentially alongside renewed energy disruption risks.
Dow Jones Outlook: Weekly Time Frame — Log Scale
Source: TradingView
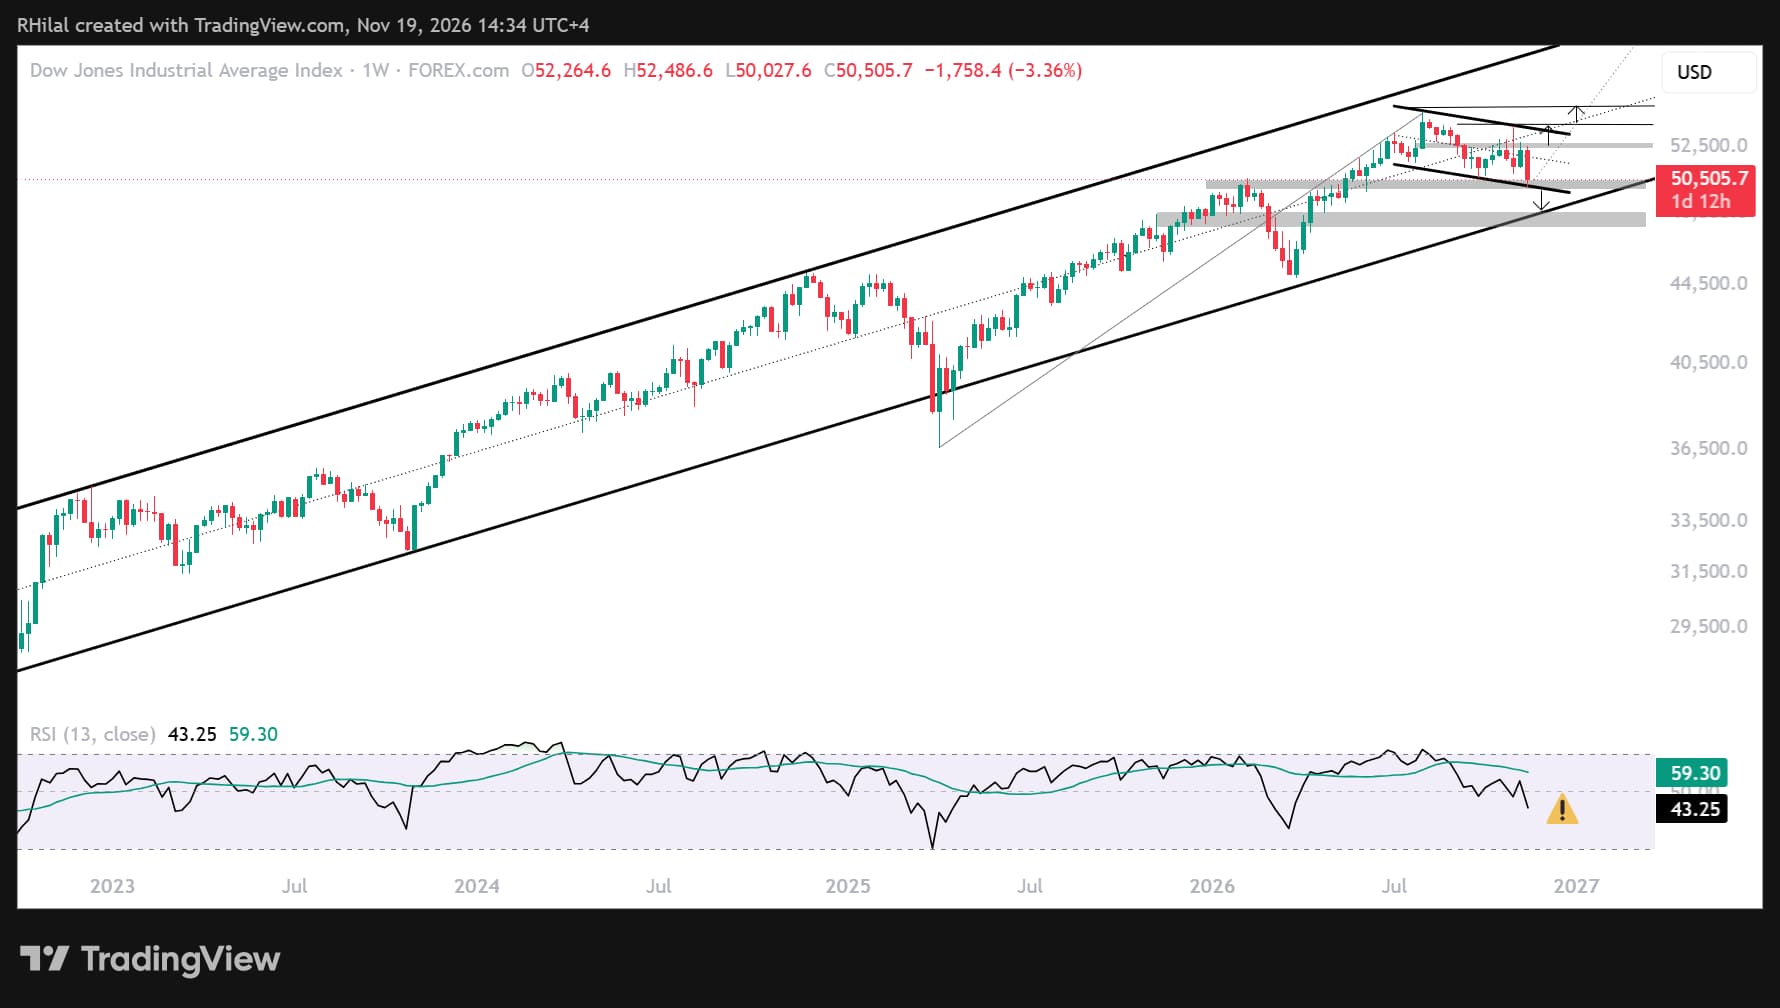
The steep sell-off in the Dow Jones may be bringing the index toward long-term support near the lower boundary of a respected uptrend channel in place since 2022.
The decline has coincided with concerns about a possible 50-basis-point rate hike following Waller’s Wednesday remarks, concerns over Medicare costs, and renewed optimism in AI-related stocks after NVIDIA reported better-than-expected earnings and ahead of Anthropic’s IPO today.
Price is holding above key support near 49,800, which aligns with:
- The 27.2% Fibonacci retracement of the April 2025–August 2026 advance
- Declining support connecting the lower lows since July 2026
- A potential August–November flag continuation pattern
A close below the 27.2% retracement and 49,800 would bring the next key support zone near 48,600–47,600 into focus. This area aligns with the four-year uptrend channel boundary and the 27.2% retracement of the 2022–2026 advance. It could present a potential long-term dip-buying area before a longer-term bearish shift is confirmed.
On the upside, closes above 52,400–52,800, followed by 54,000, could confirm a longer-term bullish continuation scenario and a potential flag pattern targeting the upper boundary of the 2022–2026 uptrend channel.
Nasdaq - NVDIA Outlook
This content was created by an affiliate of FOREX.com and represents the views and opinions of the author/speakers, not the views and opinions of Forex.com, StoneX Group Inc., or its subsidiaries. The content has not been independently reviewed by Forex.com.
The Nasdaq’s sustained hold above 26,200, alongside NVIDIA’s test of a critical confluence zone, may be setting up a potential near-term reversal. This scenario is also consistent with the prevailing extreme-fear sentiment.
Written by Razan Hilal, CMT
Follow on X: @Rh_waves
Related tags:


Open an account in minutes
Experience award-winning platforms with fast and secure execution, and enjoy tight spreads from 0.5 pts on FX and 0.3 pts on indices.
Economic calendar
Web Trader platform
Our sophisticated web-based platform is packed with features.
Related articles
Nasdaq 100, SOX: Tech rout may be a symptom of something far larger
The financial tide is going out, and some of the market's biggest winners are being hammered. Our research suggests there's more to the tech rout than the AI headlines.

Gold and Silver's Deepening Dollar Dilemma
The dollar has broken higher, gold and silver have been crushed, and US financial conditions are tightening rapidly. Our historical analysis suggests this is no ordinary precious metals selloff.

S&P 500 Analysis: SPX Is Going Through One of Its Most Difficult Periods of 2026
Confidence around the U.S. equity market continues to face significant pressure. Over the last three trading sessions alone, the S&P 500 has fallen nearly 3.3%, highlighting a bearish bias that has become increasingly evident across the broader market.

This report is intended for general circulation only. It should not be construed as a recommendation, or an offer (or solicitation of an offer) to buy or sell any financial products. The information provided does not take into account your specific investment objectives, financial situation or particular needs. Before you act on any recommendation that may be contained in this report, independent advice ought to be sought from a financial adviser regarding the suitability of the investment product, taking into account your specific investment objectives, financial situation or particular needs.
StoneX Financial Pte. Ltd., may distribute reports produced by its respective foreign entities or affiliates within the StoneX group of companies or third parties pursuant to an arrangement under Regulation 32C of the Financial Advisers Regulations. Where the report is distributed to a person in Singapore who is not an accredited investor, expert investor or an institutional investor (as defined in the Securities Futures Act), StoneX Financial Pte. Ltd. accepts legal responsibility to such persons for the contents of the report only to the extent required by law. Singapore recipients should contact StoneX Financial Pte. Ltd. at 6826 9988 for matters arising from, or in connection with the report.
In the case of all other recipients of this report, to the extent permitted by applicable laws and regulations neither StoneX Financial Pte. Ltd. nor its associated companies will be responsible or liable for any loss or damage incurred arising out of, or in connection with, any use of the information contained in this report and all such liability is hereby expressly disclaimed. No representation or warranty is made, express or implied, that the content of this report is complete or accurate.
StoneX Financial Pte. Ltd. is not under any obligation to update this report.
Trading CFDs carries a high level of risk that may not be suitable for some investors. Consider your investment objectives, level of experience, financial resources, risk appetite and other relevant circumstances carefully. The possibility exists that you could lose some or all of your investments, including your initial deposits. If in doubt, please seek independent expert advice. Visit www.forex.com/en-sg/terms-and-policies for the complete Risk Disclosure Statement.