



Asian Open Enter Taxman Wall Street lower USD Catches a Bid
US indices fell overnight as Wall Street traders are no doubt ‘miffed’ on news that the Biden Administration plans to almost double capital gains tax on high earners.
Share this:

Canadian Dollar Technical Forecast: USD/CAD Weekly Trade Levels
- Canadian Dollar pares December gains- USD/CAD rallies nearly 1.25% into yearly open
- USD/CAD rebound off multi-year trend support approaching initial resistance
- Resistance 1.3453, 1.3489, 1.3545– Support 1.3218/25, 1.3100, 1.3000
The Canadian Dollar has been on defense since the start of the year with USD/CAD rallying more than 1.8% off the December lows. A rebound off multi-year trend support is now approaching multi-month downtrend resistance and the focus is on a possible price inflection just higher. These are the updated targets and invalidation levels that matter on the USD/CAD weekly technical chart.
Review my latest Weekly Strategy Webinar for an in-depth breakdown of this Loonie setup and more. Join live on Monday’s at 8:30am EST.
Canadian Dollar Price Chart – USD/CAD Weekly
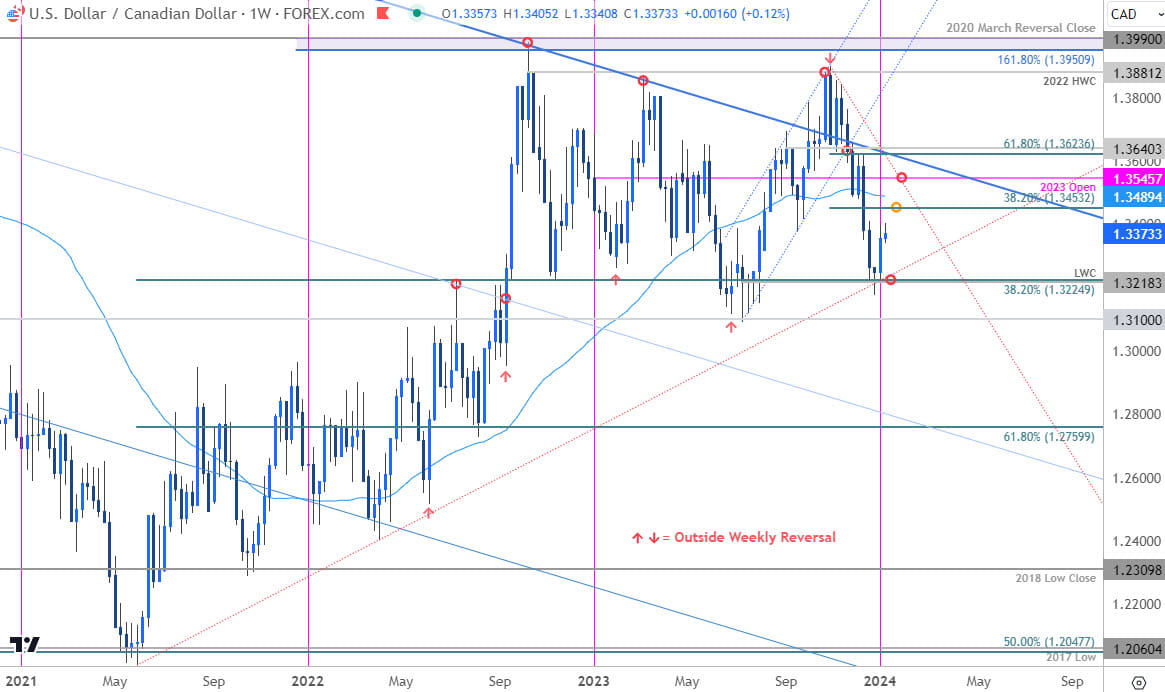
Chart Prepared by Michael Boutros, Sr. Technical Strategist; USD/CAD on TradingView
Technical Outlook: In last month’s Canadian Dollar Technical Forecast we noted that USD/CAD had broken below a multi-month uptrend with key support eyed at, “a major slope confluence at 1.3218/65- a region defined by the yearly low-week close, 38.2% retracement of the 2021 advance, and the 78.6% retracement. Look for a larger reaction there IF reached.” USD/CAD plunged into the close of 2023 with price briefly registering an intra-week low at 1.3177 before rebounding sharply into the January open.
The immediate focus is on this recovery off confluent support with initial weekly resistance eyed at the 38.2% Fibonacci retracement of the October decline at 1.3453 and the 52-week moving average (currently ~1.3489). Bearish invalidation now lowered to the 2023 yearly open at 1.3545 with a beach / close above 1.3623/40 ultimately needed to mark uptrend resumption.
Key support now tightened to the 2023 low-week close (LWC) / 38.2% retracement at 1.3218/25- a break / close below this threshold would invalidate the 2021 uptrend and threaten a more significant decline towards last year’s low around the 1.31 and the psychological 1.30-handle (look for a larger reaction there IF reached).
Bottom line: USD/CAD has rebounded off confluent uptrend support with the immediate focus on this recovery. From a trading standpoint, look to reduce long-exposure / raise protective stops on a stretch towards the October trendline – risk for an exhaustion high into 1.3545. Losses should be limited to 1.3218 IF the 2021 uptrend is to remain viable with a close above 1.3640 needed to fuel the next leg higher in price. I’ll publish an updated Canadian Dollar Short-term Outlook once we get further clarity on the near-term USD/CAD technical trade levels.
US/ Canada Economic Data Releases
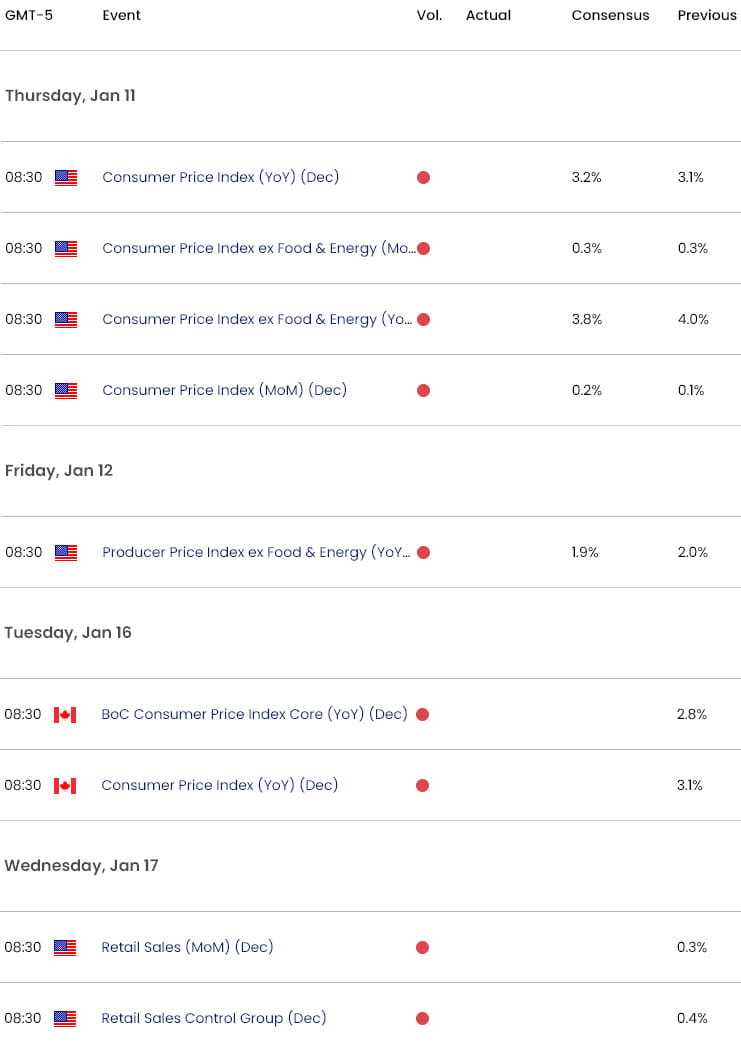
Economic Calendar - latest economic developments and upcoming event risk.
Active Weekly Technical Charts
- British Pound (GBP/USD)
- Japanese Yen (USD/JPY)
- Gold (XAU/USD)
- Australian Dollar (AUD/USD)
- US Dollar Index (DXY)
- Euro (EUR/USD)
--- Written by Michael Boutros, Sr Technical Strategist with FOREX.com
Follow Michael on X @MBForex
Related tags:


Open an account in minutes
Experience award-winning platforms with fast and secure execution.
Economic calendar
Web Trader platform
Our sophisticated web-based platform is packed with features.
Related articles
US Dollar Breakout Has History on Its Side
The US dollar is breaking higher as financial conditions tighten at a historically rapid pace. Both history and the charts suggest the rally may have further to run.

ASX 200 Outlook: Potential to Bounce Sits on a Knife Edge
ASX 200 bounce prospects remain on a knife edge as oversold technicals clash with weak financials, commodity pressures and global risk aversion.


US dollar rally loses yield support as Nvidia looms
US yields are retreating, but the dollar isn't following. With risk aversion potentially keeping it supported, Nvidia's results could determine whether emerging reversal signals in AUD/USD and EUR/USD develop further.
StoneX Financial Ltd (trading as "FOREX.com") is an execution-only service provider. This material, whether or not it states any opinions, is for general information purposes only and it does not take into account your personal circumstances or objectives. This material has been prepared using the thoughts and opinions of the author and these may change. However, FOREX.com does not plan to provide further updates to any material once published and it is not under any obligation to keep this material up to date.
This material is short term in nature and may only relate to facts and circumstances existing at a specific time or day. Nothing in this material is (or should be considered to be) financial, investment, legal, tax or other advice and no reliance should be placed on it. No opinion given in this material constitutes a recommendation by FOREX.com or the author that any particular investment, security, transaction or investment strategy is suitable for any specific person.
The material has not been prepared in accordance with legal requirements designed to promote the independence of investment research. Although FOREX.com is not specifically prevented from dealing before providing this material, FOREX.com does not seek to take advantage of the material prior to its dissemination. This material is not intended for distribution to, or use by, any person in any country or jurisdiction where such distribution or use would be contrary to local law or regulation. For further details see our full non-independent research disclaimer and quarterly summary.