



AUDUSD Does the Big Intraday Reversal Indicate a NearTerm Bottom
This morning’s US session started much in the same way as some of the previous days this week: with US stock indices opening deeply in the red. After a bounce back yesterday, risk sentiment was hurt by disappointing earnings reports from tech giants Amazon and Alphabet, and by 11:00 ET (15:00 GMT), the widely-watched Dow Jones Industrial Average was trading off by 500 points once again.
Share this:

This morning’s US session started much in the same way as some of the previous days this week: with US stock indices opening deeply in the red. After a bounce back yesterday, risk sentiment was hurt by disappointing earnings reports from tech giants Amazon and Alphabet, and by 11:00 ET (15:00 GMT), the widely-watched Dow Jones Industrial Average was trading off by 500 points once again.
Then, traders suddenly started to bid up risk assets ahead of the European close. Whether today’s nascent recovery marks a meaningful bottom or merely profit-taking by bears ahead of the weekend remains to be seen, but we are seeing some technical signs that a near-term bounce in pro-cyclical assets like AUD/USD could be in play.
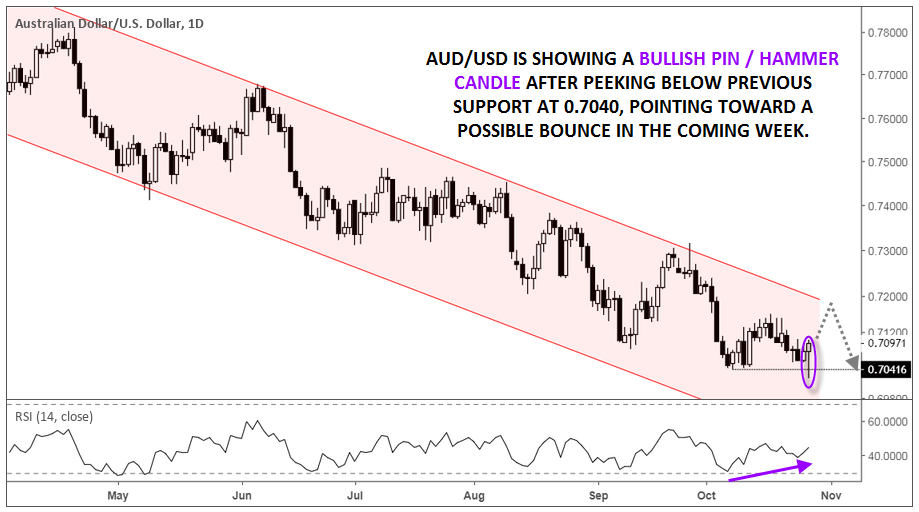
As we’ve noted repeatedly over the last few months, AUD/USD is in the “cleanest trend in the FX market,” with a well-defined bearish channel guiding rates lower since the peak in late January. After forming an “inside candle” yesterday, the pair dropped sharply early in today’s session to hit its lowest level in over two-and-a-half years near the round 0.7000 handle.
However, mirroring the price action in stock indices, the pair has reversed sharply off its intraday lows and is currently showing a large “bullish pin,” or hammer, candle on the daily chart. This pattern is often seen at near-term bottoms in a market, and combined with the previous support from earlier this month around 0.7050, suggests that the pair could bounce back heading into early next week.
To the topside, resistance sits around 0.7130 (this week’s high), followed by the top of the bearish channel just below 0.7200. As long as those levels cap rates, the longer-term momentum will continue to favor the bears. Meanwhile, a break and close back below 0.7040 would signal open the door for more weakness toward 0.6900 or lower next.
Source: TradingView, FOREX.com
Related tags:


Open an account in minutes
Experience award-winning platforms with fast and secure execution.
Economic calendar
Web Trader platform
Our sophisticated web-based platform is packed with features.
Related articles
China's steel slump leaves iron ore bulls under the pump
Iron ore has broken major support, threatening a return to the lows of 2022 as mounting evidence of weakness in China's steel sector reinforces the bearish outlook.

NZD/USD Forecast: Kiwi faces historic breakdown as RBNZ survey looms
NZD/USD is teetering above support that held through the pandemic and Liberation Day turmoil. With RBNZ hawks repeatedly disappointed, today's inflation expectations survey could open the door to a slide towards the GFC lows.

DXY, GBP/USD, AUD/USD, USD/CAD, USD/JPY, Gold Weekly Technical Outlook 11 16 2026
Sr. Technical Strategist Michael Boutros highlights the levels that matter on the USD Majors, commodities, and equity indices charts this week.

StoneX Financial Ltd (trading as "FOREX.com") is an execution-only service provider. This material, whether or not it states any opinions, is for general information purposes only and it does not take into account your personal circumstances or objectives. This material has been prepared using the thoughts and opinions of the author and these may change. However, FOREX.com does not plan to provide further updates to any material once published and it is not under any obligation to keep this material up to date.
This material is short term in nature and may only relate to facts and circumstances existing at a specific time or day. Nothing in this material is (or should be considered to be) financial, investment, legal, tax or other advice and no reliance should be placed on it. No opinion given in this material constitutes a recommendation by FOREX.com or the author that any particular investment, security, transaction or investment strategy is suitable for any specific person.
The material has not been prepared in accordance with legal requirements designed to promote the independence of investment research. Although FOREX.com is not specifically prevented from dealing before providing this material, FOREX.com does not seek to take advantage of the material prior to its dissemination. This material is not intended for distribution to, or use by, any person in any country or jurisdiction where such distribution or use would be contrary to local law or regulation. For further details see our full non-independent research disclaimer and quarterly summary.