



Crude Oil Forecast: WTI closes the week above 80 dollars
These remain relevant sessions for WTI crude oil, which has recorded an increase of just over 14% on average over the last 5 trading sessions. This behavior indicates that the buying bias remains important in the short term.
Share this:

These remain relevant sessions for WTI crude oil, which has recorded an increase of just over 14% on average over the last 5 trading sessions. This behavior indicates that the buying bias remains important in the short term.
For now, bullish pressure continues as new updates emerge around tensions in the Middle East. This dynamic continues to raise the risk premium in the oil market and keeps supporting crude prices. If no relevant reduction in conflict risk is observed, buying pressure could remain important over the next few sessions.


How is the Middle East conflict evolving?
Toward the end of the week, new relevant updates emerged around the Middle East. Reports of attacks against logistics infrastructure and ports near the Gulf once again raised concerns about a possible escalation between the United States and Iran.
This scenario continues to generate concern around the Strait of Hormuz, through which more than 25% of global oil trade passes. It also reduces expectations of a quick resolution to the conflict, as recurring attacks continue to threaten geopolitical stability despite ongoing negotiations.
This event is important for the oil market because it keeps the risk premium elevated into the end of the week and reinforces fears of lower available crude supply. If demand remains stable, a potential reduction in supply due to disruptions could continue to generate bullish pressure in the short term.
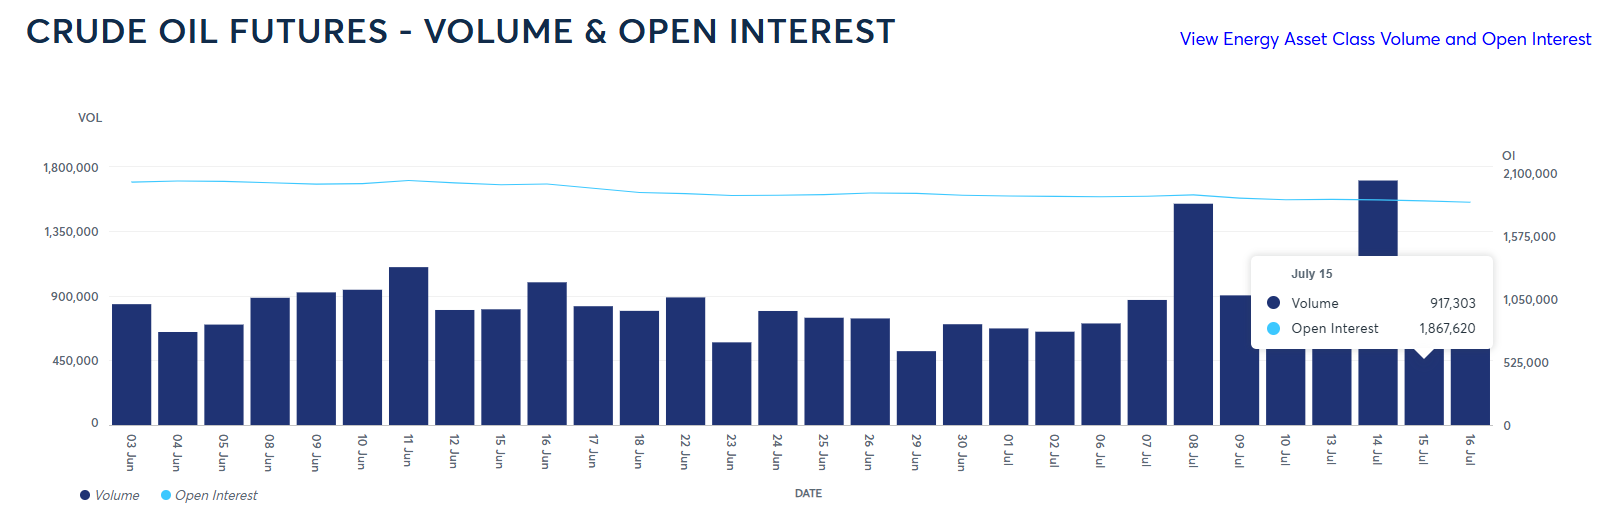
This dynamic has not only been relevant toward the end of the week. In recent sessions, as no clear progress has been seen in negotiations, activity in oil futures has remained elevated. On July 14, the highest volume peak of the month was recorded, with more than 1.7 million contracts traded, and activity remained consistent in the following sessions.
This increase in volume, combined with bullish pressure in oil prices, suggests that demand positions in crude futures have started to grow during the trading week.
Source: CMEGROUP
With all of the above in mind, potential disruptions to oil supply remain the most relevant fundamental catalyst in the short term. If new updates continue to point to delays in reliable negotiations around the Middle East, and this keeps uncertainty around a robust oil supply in place, buying pressure on WTI could remain relevant over the next few sessions.
What is happening with expected volatility?
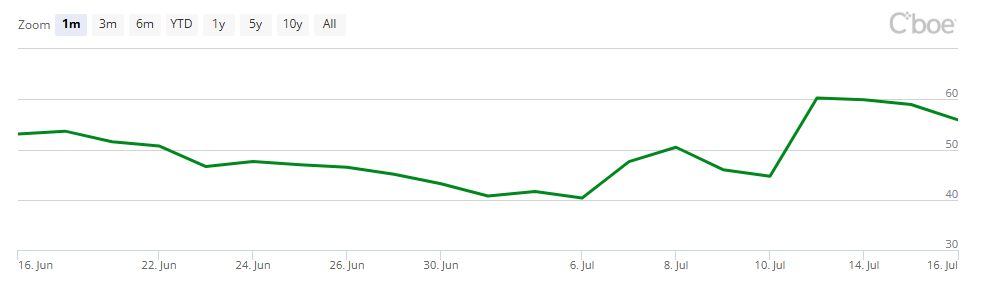
In recent trading sessions, the OVX index has rebounded toward the 60-point area, marking a new short-term upward slope. This movement suggests that the market is anticipating an increase in oil volatility, in a context where tensions in the Middle East continue to raise the risk premium on crude.
It is important to remember that the OVX measures expected oil volatility over the next 30 days, so its recent advance reflects a higher degree of nervousness among traders and potentially greater demand for hedges against sharp moves in WTI.
Source: CBOE
With this in mind, if the OVX continues to advance in the short term, the market could continue to show a greater need for protection against highly uncertain scenarios. In this context, the persistence of the geopolitical risk premium could keep WTI exposed to wide movements and eventually sustain buying pressure if fears of supply disruptions in the Middle East increase.
Technical forecast for WTI
Source: StoneX, Tradingview
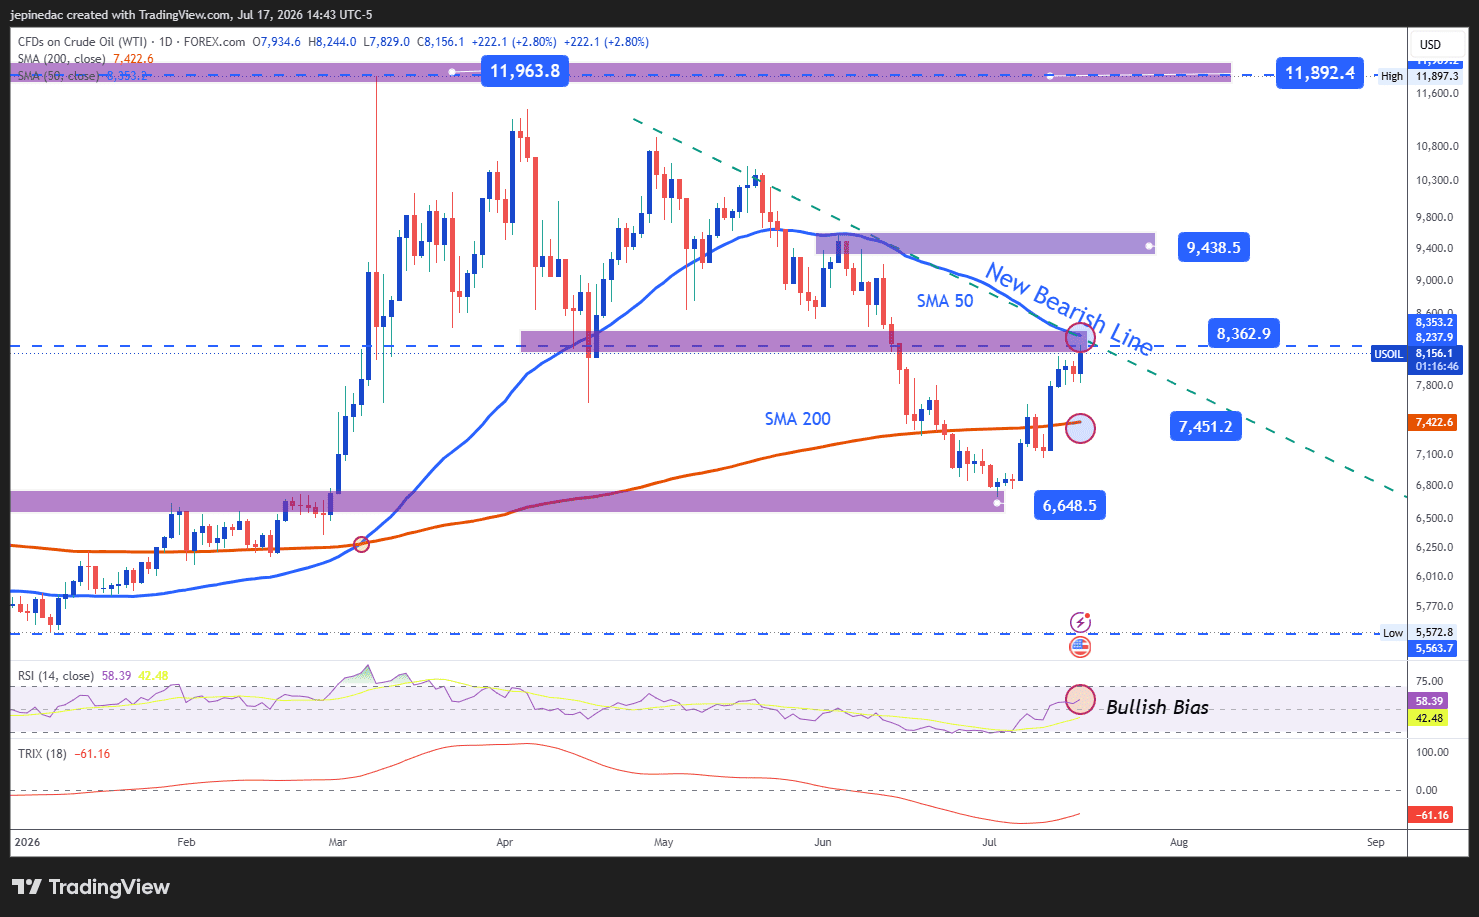
- Bearish trend line at risk: The current recovery in WTI has started to put the long bearish trend line on the daily chart at risk. This trend line has been in place since the final days of April and has been considered the most relevant technical structure over recent weeks. At the moment, price is approaching this trend line again. If relevant buying pressure manages to hold, a break of this structure could take place and open room for a stronger buying bias over the next few sessions.
- RSI: Now, the RSI is holding consistent movements above the neutral 50 level. This suggests that the average bullish impulse over the last 14 sessions has started to gain relevance and could continue to support a buying bias over the next few sessions.
- TRIX: The TRIX line has started to show an upward slope, although it still remains below the neutral 0 area. This suggests that selling strength in the exponential moving averages has started to fade, which could reflect an important shift in the chart’s dynamic and reinforce the importance of a short-term buying bias.
Key levels:
- 94 USD – Relevant resistance: This high level has not been seen since June of the current year and remains the farthest bullish barrier to watch. Price movements toward this level could reaffirm the dominance of a buying bias and open room for a potentially more relevant bullish trend line over the coming weeks.
- 83 USD – Critical barrier: This area is marked by the long bearish trend line and the 50-period simple moving average. Price movements above this level could put the dominant bearish structure at risk and start to show a clearer buying bias in the short term.
- 66 USD – Key support: This level corresponds to price lows not seen since February 2026 and currently represents the most important bearish barrier. Consistent movements below this level could reinforce a dominant selling bias and open room for a relevant extension of the bearish trend line over the coming weeks.
Written by Julian Pineda, CFA, CMT – Market Analyst
Follow him on: @julianpineda25



Open an account in minutes
Experience award-winning platforms with fast and secure execution.
Economic calendar
Web Trader platform
Our sophisticated web-based platform is packed with features.
Related articles
China's steel slump leaves iron ore bulls under the pump
Iron ore has broken major support, threatening a return to the lows of 2022 as mounting evidence of weakness in China's steel sector reinforces the bearish outlook.

DXY, GBP/USD, AUD/USD, USD/CAD, USD/JPY, Gold Weekly Technical Outlook 11 16 2026
Sr. Technical Strategist Michael Boutros highlights the levels that matter on the USD Majors, commodities, and equity indices charts this week.


Nasdaq 100 Forecast: NDX falls ahead of Nvidia’s earnings & Anthropic’s debut this week
U.S. stocks are heading for a weaker open amid a challenging macro backdrop and with AI-linked stocks once again under pressure ahead of Nvidia's results later this week. Attention is also turning to Anthropic's highly anticipated IPO.

StoneX Financial Ltd (trading as "FOREX.com") is an execution-only service provider. This material, whether or not it states any opinions, is for general information purposes only and it does not take into account your personal circumstances or objectives. This material has been prepared using the thoughts and opinions of the author and these may change. However, FOREX.com does not plan to provide further updates to any material once published and it is not under any obligation to keep this material up to date.
This material is short term in nature and may only relate to facts and circumstances existing at a specific time or day. Nothing in this material is (or should be considered to be) financial, investment, legal, tax or other advice and no reliance should be placed on it. No opinion given in this material constitutes a recommendation by FOREX.com or the author that any particular investment, security, transaction or investment strategy is suitable for any specific person.
The material has not been prepared in accordance with legal requirements designed to promote the independence of investment research. Although FOREX.com is not specifically prevented from dealing before providing this material, FOREX.com does not seek to take advantage of the material prior to its dissemination. This material is not intended for distribution to, or use by, any person in any country or jurisdiction where such distribution or use would be contrary to local law or regulation. For further details see our full non-independent research disclaimer and quarterly summary.