



Dollar Index HeadandShoulders Pattern in Play After Weak Inflation Data
With three central bank meetings on the schedule today (see my colleague Fawad Razaqzada’s reports from earlier today for previews and recaps of the BOE, ECB, and CBRT meetings) , FX traders have been understandably focused away from the world’s reserve currency. However, dollar bulls who were keyed in on this week’s inflation data were no doubt disappointed.
Share this:

With three central bank meetings on the schedule today (see my colleague Fawad Razaqzada’s reports from earlier today for previews and recaps of the BOE, ECB, and CBRT meetings) , FX traders have been understandably focused away from the world’s reserve currency. However, dollar bulls who were keyed in on this week’s inflation data were no doubt disappointed.
After last week’s surprisingly strong reading in average hourly earnings, economists were hoping to see signs that price pressures had finally “turned the corner” to consistently higher readings; this week’s data has dashed (or at least postponed) those hopes. Yesterday’s PPI report showed a surprising -0.1% m/m decline in both headline and core PPI figures for August, bringing the year-over-year rate to just 2.8%, well below the 3.3% rate expected.
Adding insult to injury, today’s CPI report also missed expectations, rising just 0.2% m/m (core only ticked higher by 0.2%), leaving the year-over-year rate at 2.7%. In other words, this week’s inflation figures have some analysts wondering whether the unexpectedly strong wage growth from Friday’s NFP report was merely statistical noise, rather than the start of a new trend of rising prices. This is a topic the Federal Reserve will be watching closely in the coming months as it decides whether to raise interest rates again in December (a rate hike in two weeks’ time is all but a done deal at this point).
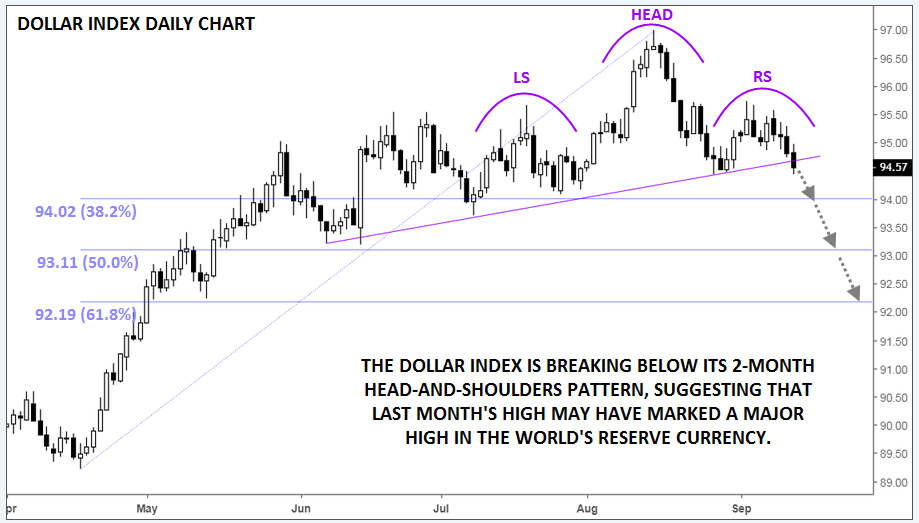
The chart of the dollar index gives bulls even more reason to worry. As the daily chart below shows, the index has carved out a head-and-shoulders pattern over the last two months; for the uninitiated, this pattern shows a transition from a bullish trend (higher highs and higher lows) to a bearish trend (lower highs and lower lows) and is often seen at significant tops in the market. With prices on track to close below the pattern’s “neckline” around 94.75 today, the pattern projects a possible move down toward 92.00 in time. From a shorter-term perspective, the Fibonacci retracements of the April-August rally at 94.02 (38.2%), 93.11 (50%), and 92.19 (61.8%) could provide support along the way.
Of course, we’d never endorse trading off a single pattern or indicator, but readers should at least keep their minds open to the possibility that the greenback may have seen its highest levels of the year last month.
Source: TradingView, FOREX.com
Related tags:
Latest market news




Open an account in minutes
Experience award-winning platforms with fast and secure execution.
Economic calendar
Web Trader platform
Our sophisticated web-based platform is packed with features.
Related articles
DXY, GBP/USD, AUD/USD, USD/CAD, USD/JPY, Gold Weekly Technical Outlook 11 16 2026
Sr. Technical Strategist Michael Boutros highlights the levels that matter on the USD Majors, commodities, and equity indices charts this week.


Crude Oil Weekly Outlook: Geopolitics vs Oversupply Risks
Crude Oil Weekly Outlook: The IEA has flagged the risk of an oil supply surplus since the Iran war began. Yet WTI and Brent have held onto bullish rebounds from key support near 84 and 89, respectively, as geopolitical risks persist.


Nikkei swings harder than Nasdaq as AI fears deepen
Nikkei 225 volatility is running well ahead of Nasdaq 100, with the index construction and Japan's heavy exposure to AI manufacturing potentially explaining the difference.

StoneX Financial Ltd (trading as "FOREX.com") is an execution-only service provider. This material, whether or not it states any opinions, is for general information purposes only and it does not take into account your personal circumstances or objectives. This material has been prepared using the thoughts and opinions of the author and these may change. However, FOREX.com does not plan to provide further updates to any material once published and it is not under any obligation to keep this material up to date.
This material is short term in nature and may only relate to facts and circumstances existing at a specific time or day. Nothing in this material is (or should be considered to be) financial, investment, legal, tax or other advice and no reliance should be placed on it. No opinion given in this material constitutes a recommendation by FOREX.com or the author that any particular investment, security, transaction or investment strategy is suitable for any specific person.
The material has not been prepared in accordance with legal requirements designed to promote the independence of investment research. Although FOREX.com is not specifically prevented from dealing before providing this material, FOREX.com does not seek to take advantage of the material prior to its dissemination. This material is not intended for distribution to, or use by, any person in any country or jurisdiction where such distribution or use would be contrary to local law or regulation. For further details see our full non-independent research disclaimer and quarterly summary.