






EURUSD and DXY at key levels
Watch 1.2050 as the line in the sand!
Share this:

The fundamental data released from Europe earlier was not good. Retail sales from Germany for December were -9.6% vs -1.2% expected and +1.1% in November. In addition, Spain became the first of the major European countries to post a Manufacturing PMI below the expansion/contraction level of 50, with a print of 49.3. This helped drag collective European figure down from 55.2 to 54.8 for January. With lockdowns and restrictions in full effect across Europe, the economic data is likely to continue to be sub-par. ECB is in “wait and see” mode, however last week they warned that markets were underestimated the chance of a rate cut.
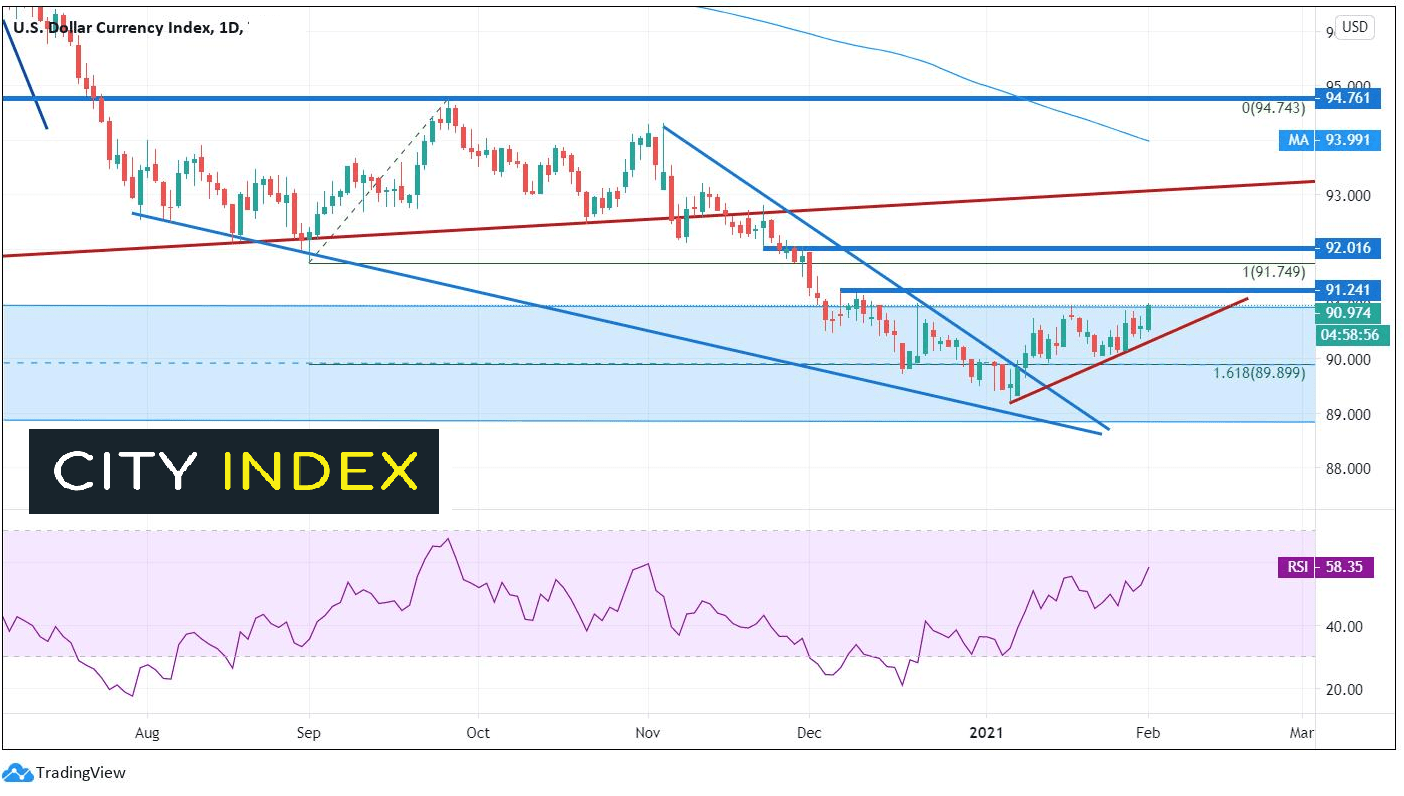
A good deal of the EUR/USD movement depends on the movement of the US Dollar. A daily chart of the DXY shows that price broke out of a descending wedge back on January 8th, and so far, has held the 161.8% Fibonacci extension from the September 1st, 2020 lows to the September 25th, 2020 highs. It also has held the support zone between 89.00 and 91.00, dating back to January 2018. The US Dollar Index appears to be desperately trying to break above 91.00. I move above 91.24 would clear the way for a move to 91.75 and 92.01. If price fails at 91, a move to trendline support near 90.50 and horizontal support near 90.05 is possible.
Source: Tradingview, City Index
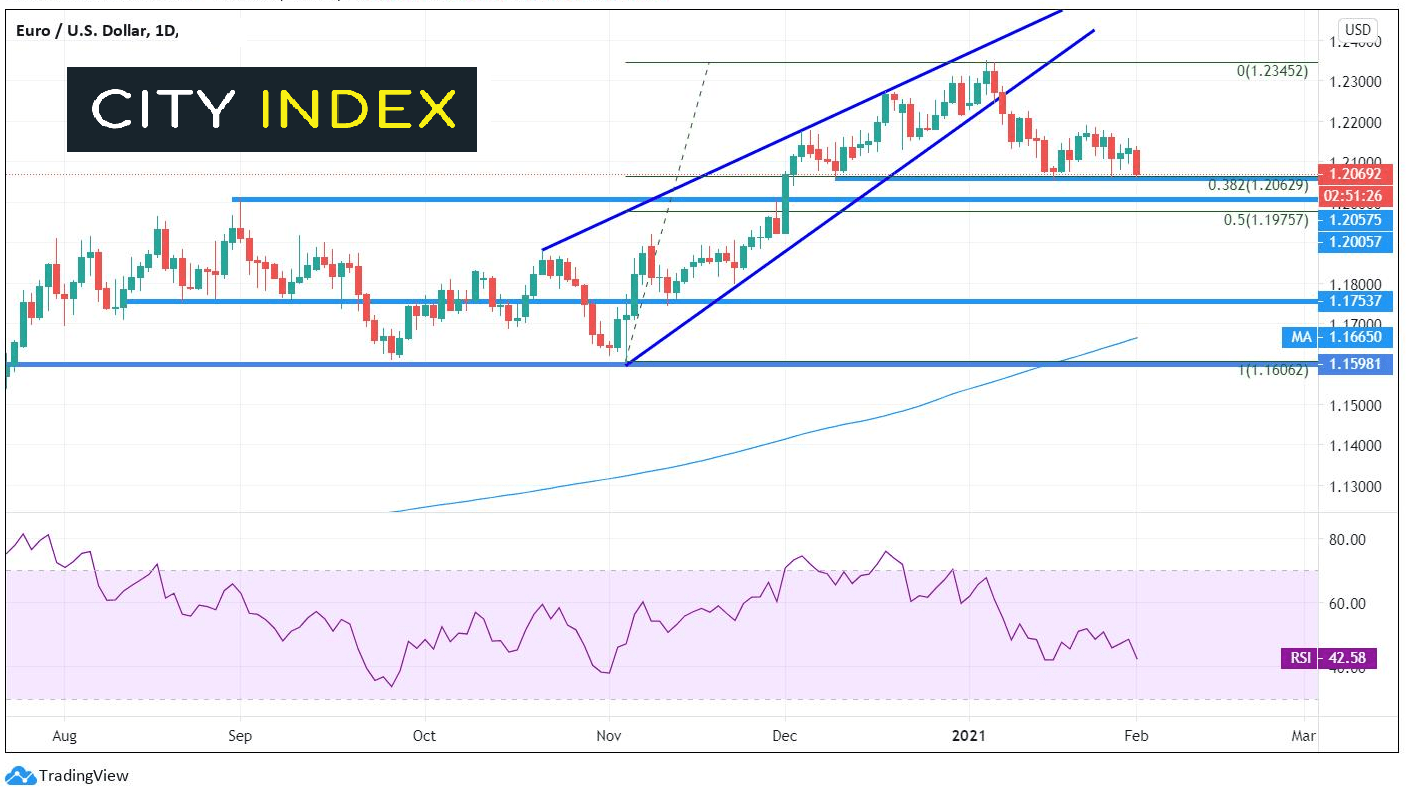
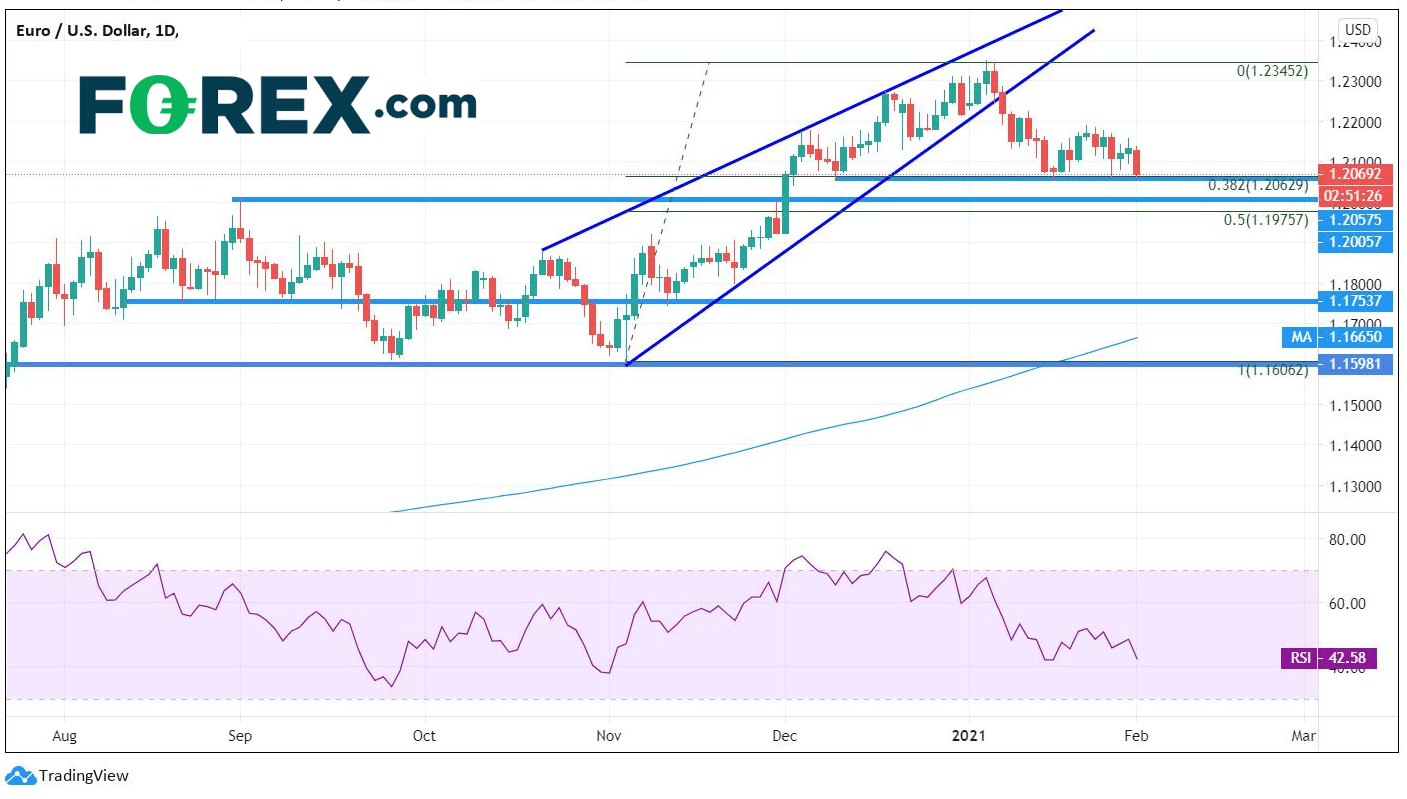
Most of the time, EUR/USD acts inversely to the DXY. Just as DXY has broken out of a descending wedge and is trying to move higher, EUR/USD has broken down from an ascending wedge and is trying to move lower. A close move below horizontal support and the 38.2% Fibonacci retracement level near 1.2063/1.2050 would open the door for a move down to 1.2011, which is previous highs September 1st, 2020. However, bulls are guarding the 1.2050 level, just as they did not January 18th. Below 1.2011, 1.1975 is the 50% retracement from the previously mentioned timeframe which will offer the next support level.
Source: Tradingview, City Index
On a 240-minute chart, we get a better sense of the range EUR/USD has been in since January 8th. inversely to DXY, a downward sloping trendline (red) has formed putting in lower highs. Bears will be looking to sell at that trendline on any bounces, which is currently near 1.2150. If price breaks above, EUR/USD could head back to recent highs near 1.2190.
Source: Tradingview, City Index
In addition to the poor economic data lately from Europe and the warning from the ECB that a rate cut may be on the way, the technical picture doesn’t look so great either. If the virus continues to worsen in Europe and it continues to show up in the economic data, the ECB will be forced to act. Right now, US stimulus is priced in. If the ECB hints at more stimulus, this will also add pressure to EUR/USD. For now, watch 1.2050 as the line in the sand!
Learn more about forex trading opportunities.
The fundamental data released from Europe earlier was not good. Retail sales from Germany for December were -9.6% vs -1.2% expected and +1.1% in November. In addition, Spain became the first of the major European countries to post a Manufacturing PMI below the expansion/contraction level of 50, with a print of 49.3. This helped drag collective European figure down from 55.2 to 54.8 for January. With lockdowns and restrictions in full effect across Europe, the economic data is likely to continue to be sub-par. ECB is in “wait and see” mode, however last week they warned that markets were underestimated the chance of a rate cut.
A good deal of the EUR/USD movement depends on the movement of the US Dollar. A daily chart of the DXY shows that price broke out of a descending wedge back on January 8th, and so far, has held the 161.8% Fibonacci extension from the September 1st, 2020 lows to the September 25th, 2020 highs. It also has held the support zone between 89.00 and 91.00, dating back to January 2018. The US Dollar Index appears to be desperately trying to break above 91.00. I move above 91.24 would clear the way for a move to 91.75 and 92.01. If price fails at 91, a move to trendline support near 90.50 and horizontal support near 90.05 is possible.
Source: Tradingview, FOREX.com
Most of the time, EUR/USD acts inversely to the DXY. Just as DXY has broken out of a descending wedge and is trying to move higher, EUR/USD has broken down from an ascending wedge and is trying to move lower. A close move below horizontal support and the 38.2% Fibonacci retracement level near 1.2063/1.2050 would open the door for a move down to 1.2011, which is previous highs September 1st, 2020. However, bulls are guarding the 1.2050 level, just as they did not January 18th. Below 1.2011, 1.1975 is the 50% retracement from the previously mentioned timeframe which will offer the next support level.
Source: Tradingview, FOREX.com
On a 240-minute chart, we get a better sense of the range EUR/USD has been in since January 8th. inversely to DXY, a downward sloping trendline (red) has formed putting in lower highs. Bears will be looking to sell at that trendline on any bounces, which is currently near 1.2150. If price breaks above, EUR/USD could head back to recent highs near 1.2190.
Source: Tradingview, FOREX.com
In addition to the poor economic data lately from Europe and the warning from the ECB that a rate cut may be on the way, the technical picture doesn’t look so great either. If the virus continues to worsen in Europe and it continues to show up in the economic data, the ECB will be forced to act. Right now, US stimulus is priced in. If the ECB hints at more stimulus, this will also add pressure to EUR/USD. For now, watch 1.2050 as the line in the sand!
Learn more about forex trading opportunities.

Open an account in minutes
Experience award-winning platforms with fast and secure execution.
Economic calendar
Web Trader platform
Our sophisticated web-based platform is packed with features.
Related articles

NZD/USD Forecast: Kiwi faces historic breakdown as RBNZ survey looms
NZD/USD is teetering above support that held through the pandemic and Liberation Day turmoil. With RBNZ hawks repeatedly disappointed, today's inflation expectations survey could open the door to a slide towards the GFC lows.

USD/JPY, AUD/JPY: Central Bank Divergence Creates Two-Way Risk
USD/JPY eyes a breakout above 160, while AUD/JPY faces further losses as Fed, RBA and BoJ interest rate expectations diverge.


DXY, GBP/USD, AUD/USD, USD/CAD, USD/JPY, Gold Weekly Technical Outlook 11 16 2026
Sr. Technical Strategist Michael Boutros highlights the levels that matter on the USD Majors, commodities, and equity indices charts this week.

StoneX Financial Ltd (trading as "FOREX.com") is an execution-only service provider. This material, whether or not it states any opinions, is for general information purposes only and it does not take into account your personal circumstances or objectives. This material has been prepared using the thoughts and opinions of the author and these may change. However, FOREX.com does not plan to provide further updates to any material once published and it is not under any obligation to keep this material up to date.
This material is short term in nature and may only relate to facts and circumstances existing at a specific time or day. Nothing in this material is (or should be considered to be) financial, investment, legal, tax or other advice and no reliance should be placed on it. No opinion given in this material constitutes a recommendation by FOREX.com or the author that any particular investment, security, transaction or investment strategy is suitable for any specific person.
The material has not been prepared in accordance with legal requirements designed to promote the independence of investment research. Although FOREX.com is not specifically prevented from dealing before providing this material, FOREX.com does not seek to take advantage of the material prior to its dissemination. This material is not intended for distribution to, or use by, any person in any country or jurisdiction where such distribution or use would be contrary to local law or regulation. For further details see our full non-independent research disclaimer and quarterly summary.