



Finally a glimmer of hope for crude oil prices
Share this:

Perhaps the most compelling story in financial markets as of late has been the dramatic and enduring plunge in crude oil prices, as serious oversupply issues and concerns over potentially waning demand have placed tremendous pressure on both the Brent Crude and West Texas Intermediate (WTI) oil benchmarks.
This drop in prices has continued on since mid-2014, when both benchmarks were trading well above the $100 per barrel mark. Worries accelerated as the plummet persevered throughout 2015, bringing prices down to multi-year lows. This has culminated most recently in both Brent and WTI hitting 12-year lows around the $27 level just last week.
Since the latter part of last year, it seemed to have been virtually a hopeless cause for crude oil prices, as major oil-producing nations were reluctant to lose market share by restraining output. Further exacerbating this situation has been a post-sanction Iran that purportedly has plans to implement an aggressive production and export schedule in order to make up for lost time and oil revenue. To make matters even worse, an apparently slowing economy in China, which is the second largest oil consumer after the U.S., prompted concerns over potentially weakening demand for crude oil.
On Thursday, this very pessimistic situation was uplifted by a glimmer of hope. Major oil-producing countries, including Saudi Arabia and Russia, which were previously disinclined to agree upon a cut in production to support prices, have begun to feel enough pressure to at least talk about the possibility of limiting current output levels. According to Russian Energy Minister Alexander Novak, Saudi Arabia has proposed up to a 5% reduction in output by each oil-producing nation. Also proposed was a meeting among oil and energy ministers of both OPEC and non-OPEC nations to discuss the situation.
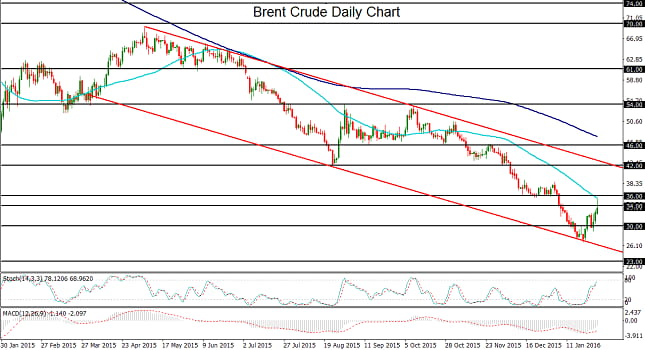
On this news of potential cooperation after so many months of non-cooperation, the initial knee-jerk reaction was swift and substantial. Brent crude surged briefly above $35, establishing a three-week high, before paring those gains as the news settled in. The high that was reached was right at the key 50-day moving average, and closely approached major resistance around the $36 level.
From a longer-term perspective, the Brent crude chart has been forming a large parallel downtrend channel since May of last year. The noted low around $27 last week touched the bottom of this channel before bouncing, which hinted that crude oil had been well oversold and over-extended to the downside, and should have been due for at least a limited relief rally.
Now that this relief rally is occurring, is a possible cooperation among oil-producing nations enough to sustain an actual recovery in oil prices? This will clearly depend on the extent and scope of participation in this potential agreement. A broad-based, substantive agreement that includes most of the largest oil producers would very likely have a substantially positive impact on oil prices.
From a technical perspective, the noted $36 resistance level is the key upside price area to watch. Any sustained breakout above $36 and the nearby 50-day moving average could open the way towards the next major resistance target at $42, followed by the key $46 resistance level.
Related tags:


Open an account in minutes
Experience award-winning platforms with fast and secure execution.
Economic calendar
Web Trader platform
Our sophisticated web-based platform is packed with features.
Related articles
China's steel slump leaves iron ore bulls under the pump
Iron ore has broken major support, threatening a return to the lows of 2022 as mounting evidence of weakness in China's steel sector reinforces the bearish outlook.

NZD/USD Forecast: Kiwi faces historic breakdown as RBNZ survey looms
NZD/USD is teetering above support that held through the pandemic and Liberation Day turmoil. With RBNZ hawks repeatedly disappointed, today's inflation expectations survey could open the door to a slide towards the GFC lows.

DXY, GBP/USD, AUD/USD, USD/CAD, USD/JPY, Gold Weekly Technical Outlook 11 16 2026
Sr. Technical Strategist Michael Boutros highlights the levels that matter on the USD Majors, commodities, and equity indices charts this week.

StoneX Financial Ltd (trading as "FOREX.com") is an execution-only service provider. This material, whether or not it states any opinions, is for general information purposes only and it does not take into account your personal circumstances or objectives. This material has been prepared using the thoughts and opinions of the author and these may change. However, FOREX.com does not plan to provide further updates to any material once published and it is not under any obligation to keep this material up to date.
This material is short term in nature and may only relate to facts and circumstances existing at a specific time or day. Nothing in this material is (or should be considered to be) financial, investment, legal, tax or other advice and no reliance should be placed on it. No opinion given in this material constitutes a recommendation by FOREX.com or the author that any particular investment, security, transaction or investment strategy is suitable for any specific person.
The material has not been prepared in accordance with legal requirements designed to promote the independence of investment research. Although FOREX.com is not specifically prevented from dealing before providing this material, FOREX.com does not seek to take advantage of the material prior to its dissemination. This material is not intended for distribution to, or use by, any person in any country or jurisdiction where such distribution or use would be contrary to local law or regulation. For further details see our full non-independent research disclaimer and quarterly summary.