



Oil Tests 120, USD/JPY 160, EUR/USD Bear Pennant – US Dollar Price Action Setups
Several markets are on the verge of significant moves as tensions in the Middle East continue to tighten. In the US Dollar it’s all about USD/JPY which can then drive EUR/USD and GBP/USD.
Share this:

It’s an interesting backdrop as we go deeper into an important week. Later this week US inflation data is expected to show the initial impact of higher energy prices. But before we get to that inflation expectations are front-and-center as oil prices continue to push towards that vital 120 level that, so far, hasn’t been crossed since tensions started to tighten in early-March.
That price is significant as the 1.618 extension of the 2023-2025 move rests at 119.58, and so far, that’s where bears have defended following the breakout last month. But – bulls haven’t exactly been relaxed on the matter as they’ve defended progressively higher-lows at 85 and then 90 and, more recently, 100 and 110.
There’s now an open door to test for a breakout and if we do see President Trump follow through on his pledge, we could see that scenario play out later tonight and into tomorrow.
US Oil Four-Hour Chart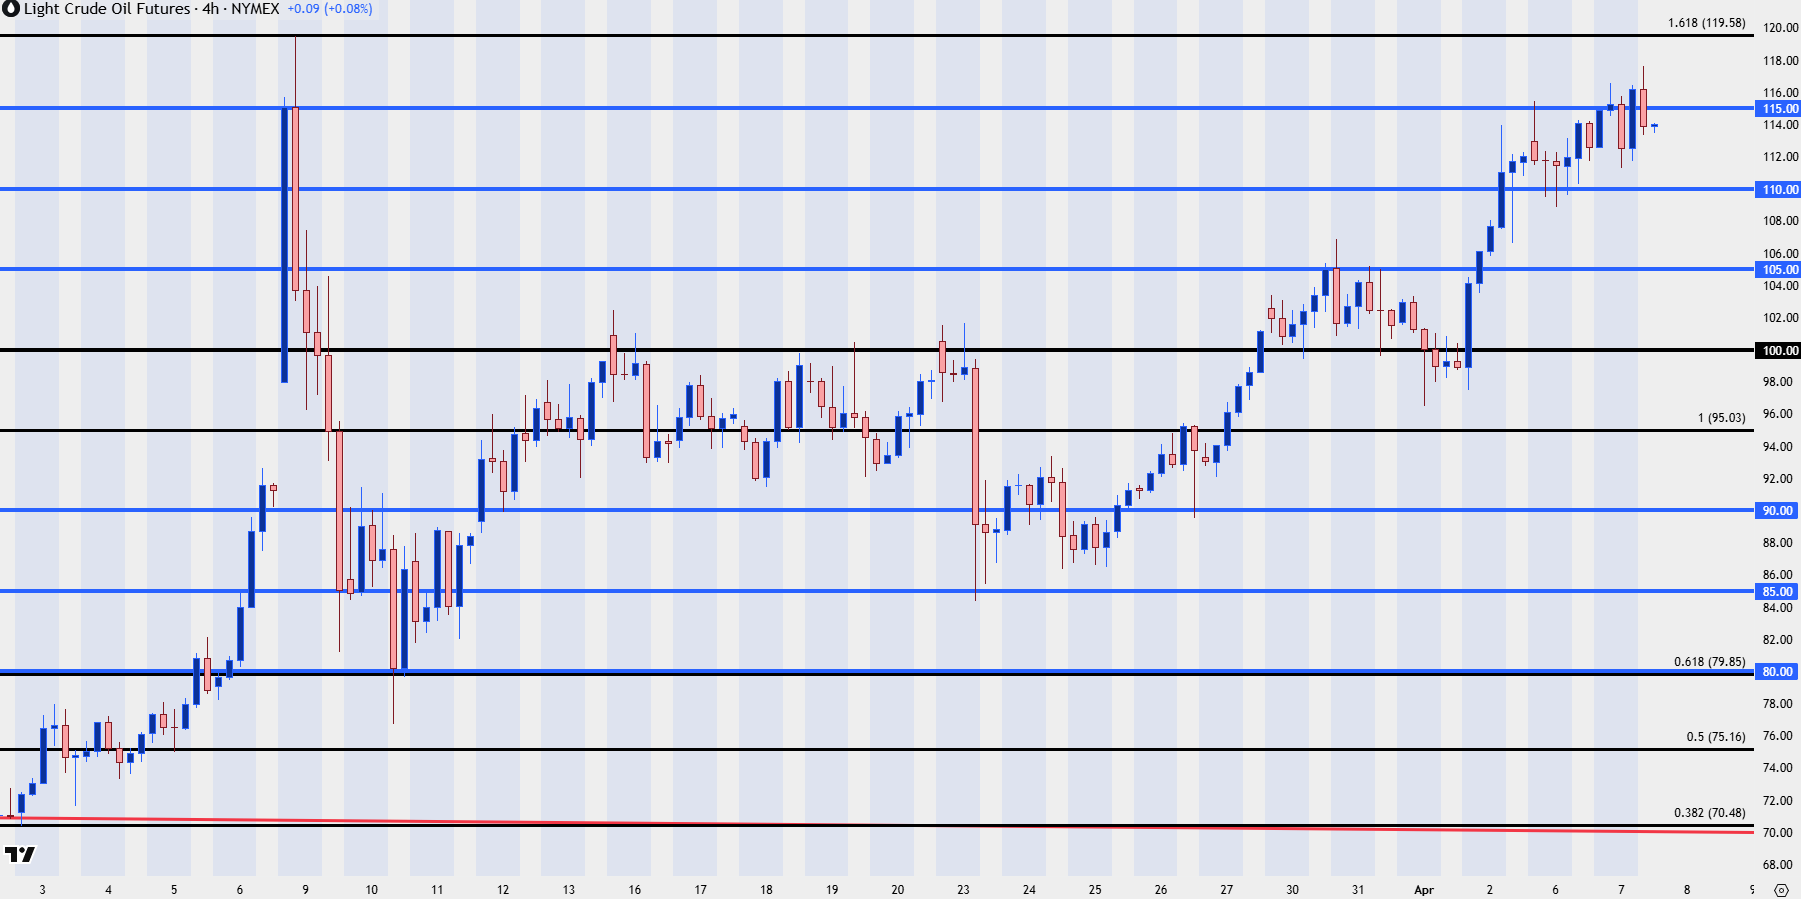
Chart prepared by James Stanley; data derived from Tradingview
USD through USD/JPY
Correlations are dangerous because they often shift. Situational alignment, however, can make more sense as we’ll often see factors align to where one thing could impact the other.
There’s a backdrop there for the US Dollar with oil prices, as a surging bid for oil could lead to USD-strength, which could, in-turn, make for a more daunting backdrop for the BoJ to try to intervene to defend the 160.00 level that’s been bending of late. That could press a situation similar to 2022, where the 145.00 level was the initial spot of defense which buyers eventually ran over, pushing price up to the 150.00 handle before the BoJ ultimately jumped into defend 151.95.
At this point, the 2024 high that was 1,000 pips above that level is the next obvious spot above the big figure, and if we’re to see the USD ascending triangle breakout, it would seem we would also need to see USD/JPY taking out that 160.00 level.
USD/JPY Weekly Price Chart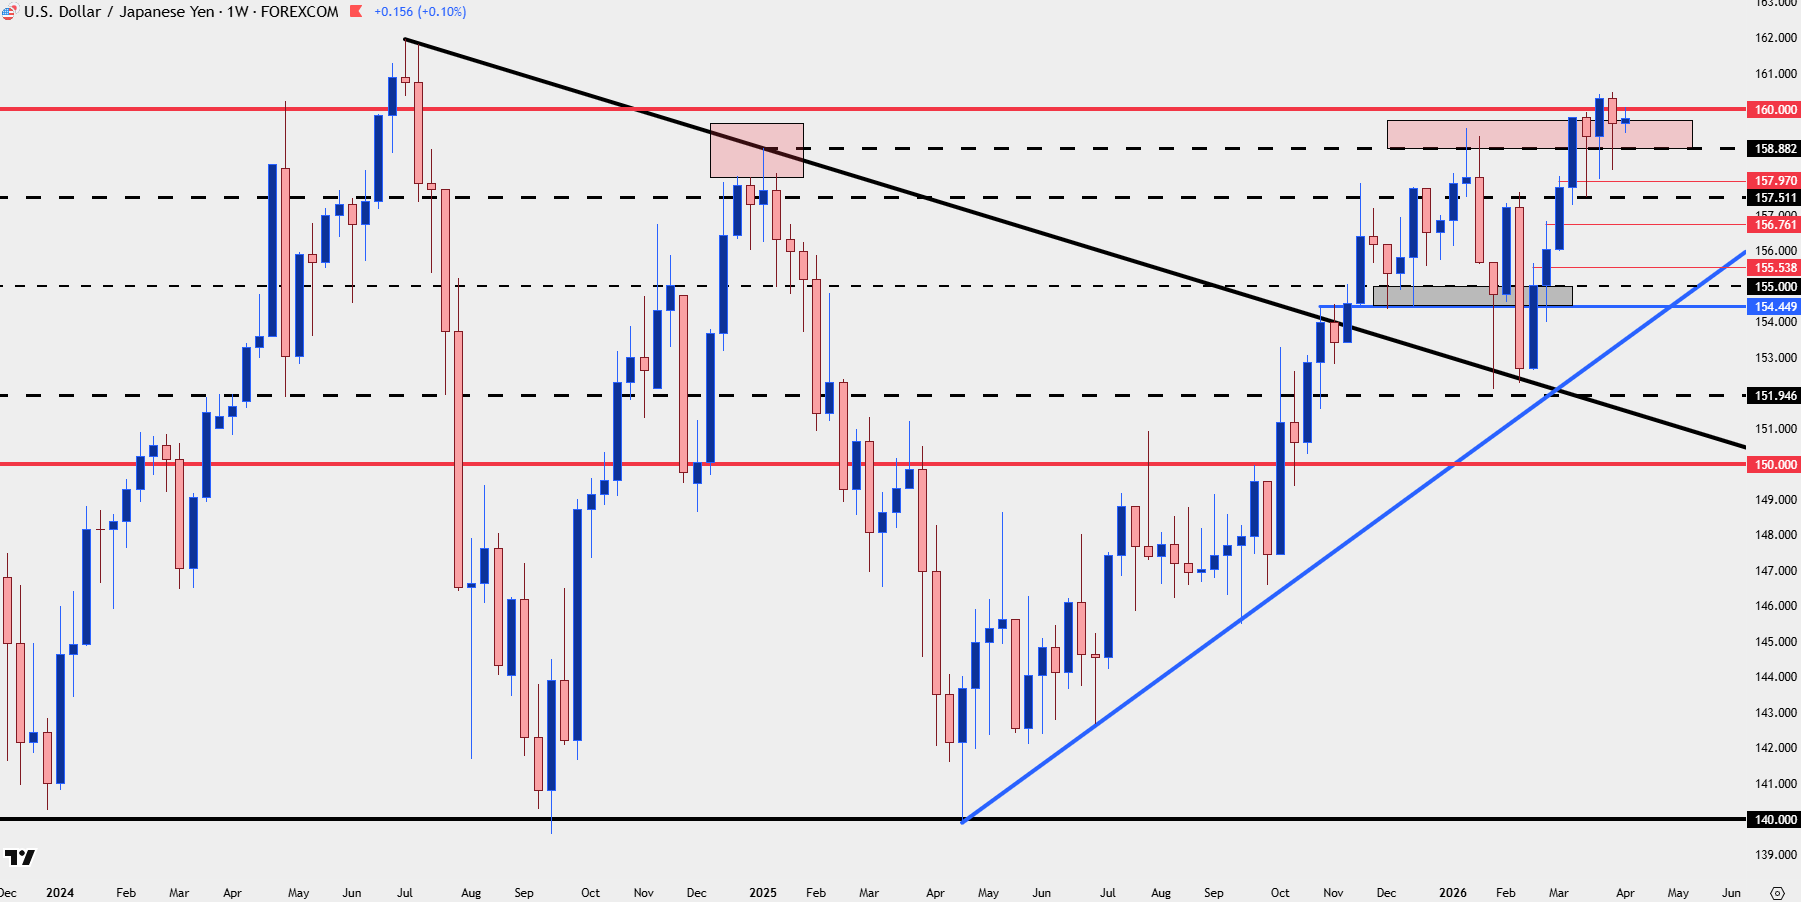
Chart prepared by James Stanley; data derived from Tradingview
USD
For the US Dollar to breakout it seems we will need to see the above setup in USD/JPY to break out above 160.00. If we do see weakness in USD/JPY, whether by intervention or not, then short-term USD weakness could become attractive with deeper supports at 98.83-98.98 and then around the 97.92-98.01 zones. The latter zone was resistance in the ascending triangle that led to the March breakout and to date, it hasn’t yet been re-tested as support.
US Dollar Daily Chart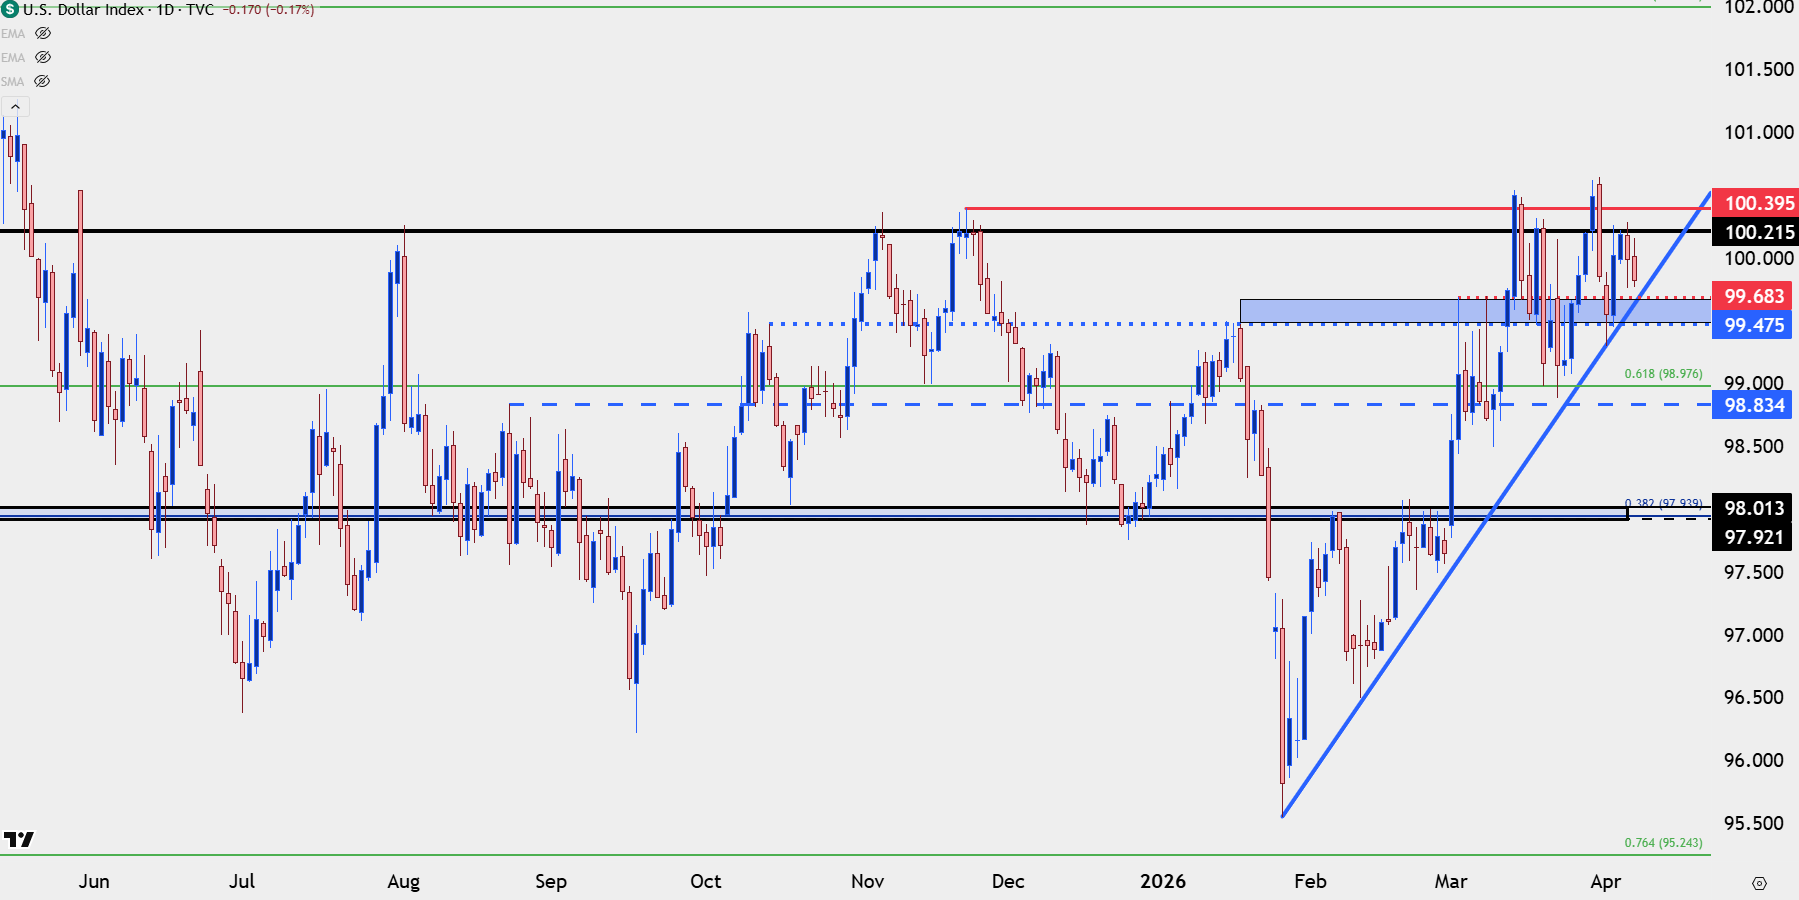
Chart prepared by James Stanley; data derived from Tradingview
EUR/USD
For USD-weakness, I continue to favor EUR/USD as there’s been a build and hold of higher-lows following last week’s bounce from 1.1451. In effort of transparency, there is potential for bears, as well, as the symmetrical triangle that’s built over the past month can be construed as a bear pennant formation. But, for USD-strength I prefer the above in USD/JPY while weakness, in my opinion, will be too difficult to work with in the USD/JPY setup as the unwind there could happen very quickly.
In EUR/USD, near-term resistance at 1.1628-1.1655 is the zone that bulls need to take out to exhibit a great degree of control.
EUR/USD Daily Chart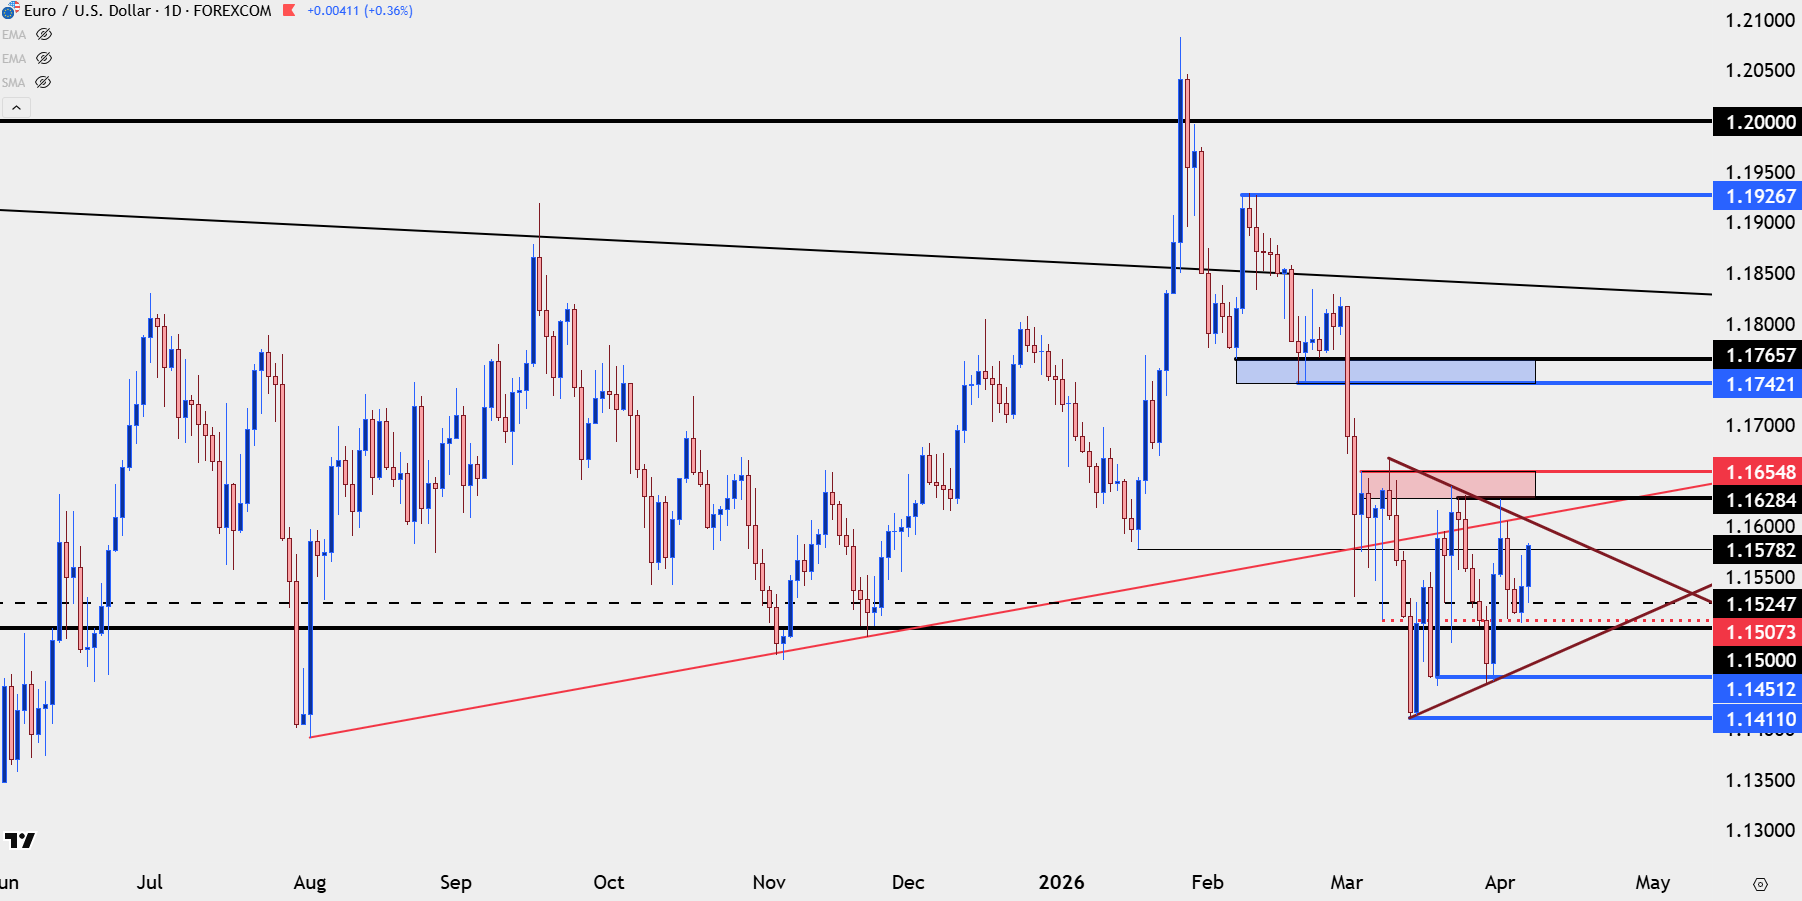
Chart prepared by James Stanley; data derived from Tradingview
GBP/USD
Of late, GBP/USD has underperformed EUR/USD and the EUR/GBP chart below will illustrate that. But of interest for USD-bears is the prospect of bullish reversals in Cable, and the pair is working on a falling wedge formation that could set up well for those looking to take the short side of the DXY basket.
GBP/USD Daily Price Chart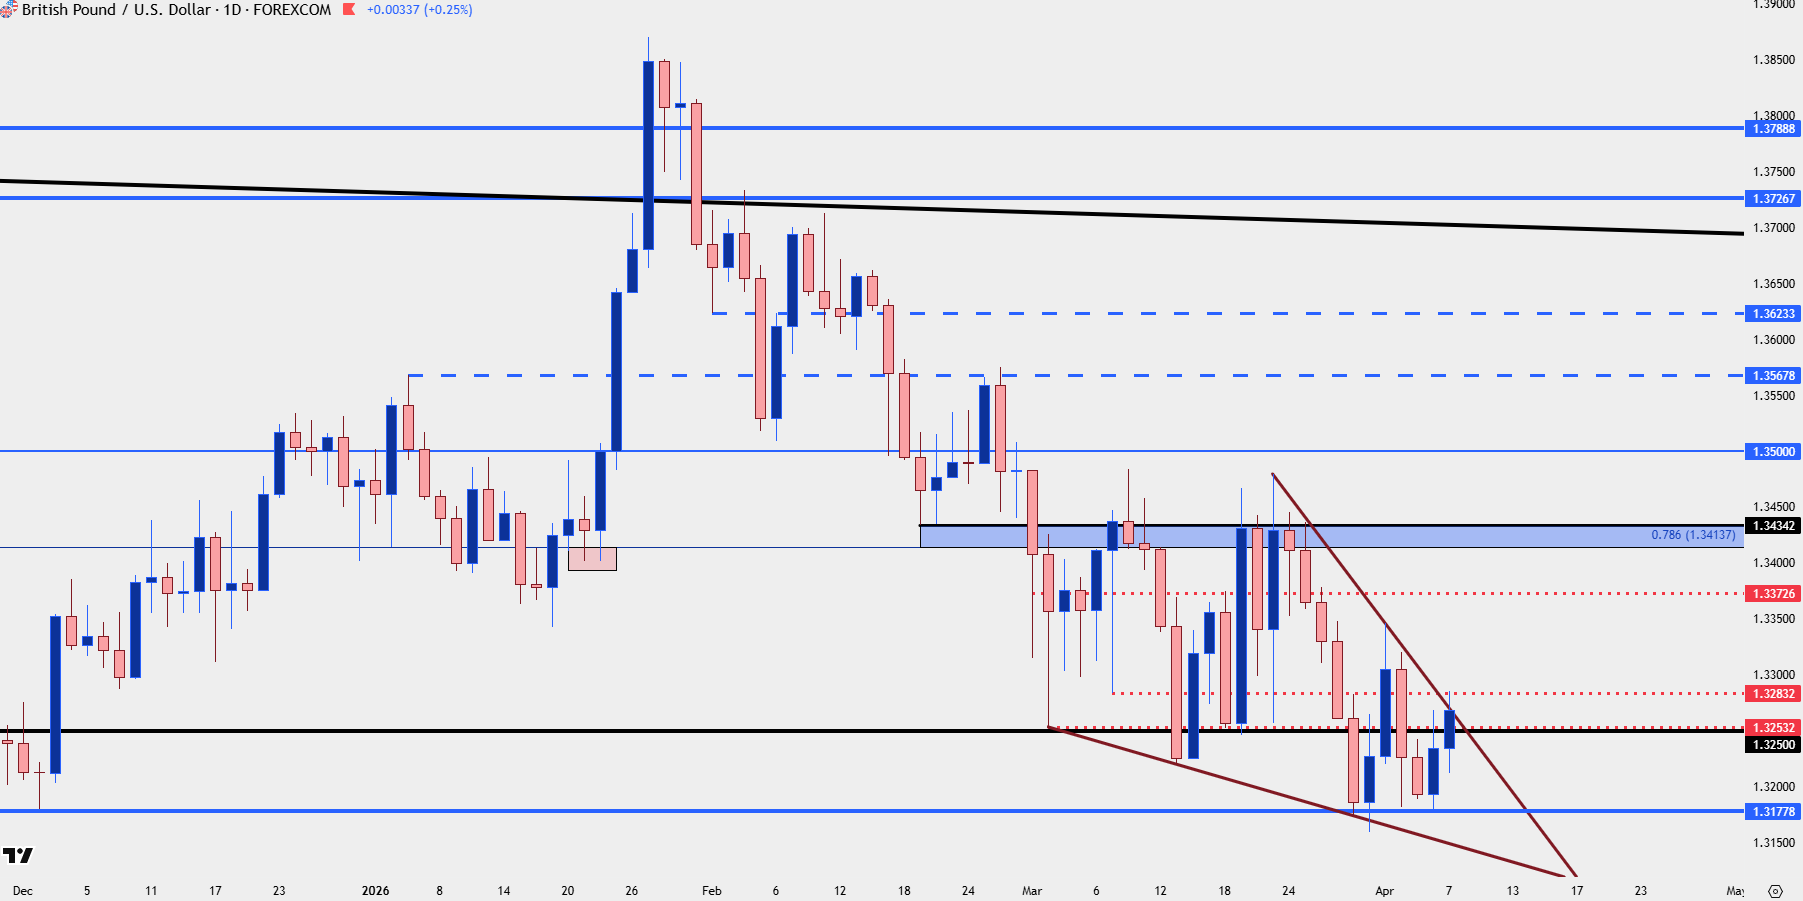
Chart prepared by James Stanley; data derived from Tradingview
EUR/GBP
Speaking to the above dynamic in EUR/USD and GBP/USD, the cross pair has been range bound for most of the past seven months and currently finds itself at a key spot of resistance around the 0.8750 level. This setup can be tracked in a couple of different ways, either by looking for mean reversion in the cross, or by focusing in on GBP/USD strength potential versus the Euro and EUR/USD in the above major pairings.
EUR/GBP Weekly Price Chart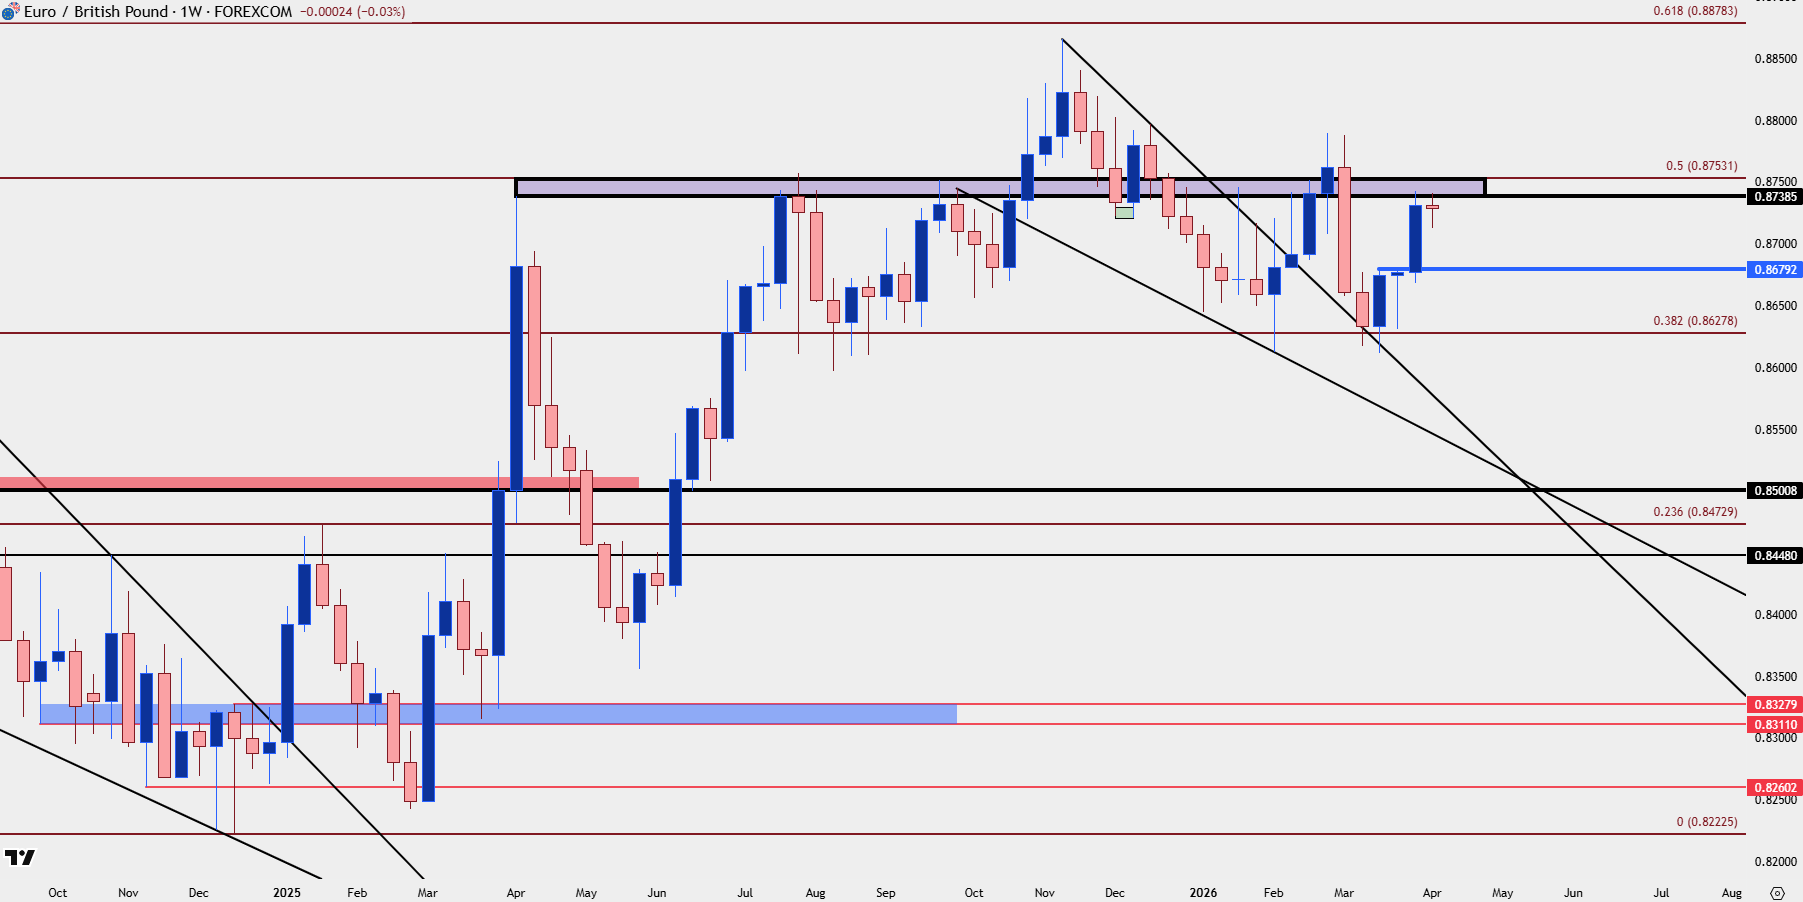
Chart prepared by James Stanley; data derived from Tradingview
--- written by James Stanley, Senior Market Analyst, Global Macro

Open an account in minutes
Experience award-winning platforms with fast and secure execution.
Economic calendar
Web Trader platform
Our sophisticated web-based platform is packed with features.
Related articles

USD/JPY, AUD/JPY: Central Bank Divergence Creates Two-Way Risk
USD/JPY eyes a breakout above 160, while AUD/JPY faces further losses as Fed, RBA and BoJ interest rate expectations diverge.


DXY, GBP/USD, AUD/USD, USD/CAD, USD/JPY, Gold Weekly Technical Outlook 11 16 2026
Sr. Technical Strategist Michael Boutros highlights the levels that matter on the USD Majors, commodities, and equity indices charts this week.


S&P, Nasdaq Slide as NVDA, AI Worries Continue to Build
It was a busy weekend in the headlines as a campaign to bring back Jensen Huang atop NVDA gained steam, even with accusations of possible treason and a circular funding model that has started to raise questions.
StoneX Financial Ltd (trading as "FOREX.com") is an execution-only service provider. This material, whether or not it states any opinions, is for general information purposes only and it does not take into account your personal circumstances or objectives. This material has been prepared using the thoughts and opinions of the author and these may change. However, FOREX.com does not plan to provide further updates to any material once published and it is not under any obligation to keep this material up to date.
This material is short term in nature and may only relate to facts and circumstances existing at a specific time or day. Nothing in this material is (or should be considered to be) financial, investment, legal, tax or other advice and no reliance should be placed on it. No opinion given in this material constitutes a recommendation by FOREX.com or the author that any particular investment, security, transaction or investment strategy is suitable for any specific person.
The material has not been prepared in accordance with legal requirements designed to promote the independence of investment research. Although FOREX.com is not specifically prevented from dealing before providing this material, FOREX.com does not seek to take advantage of the material prior to its dissemination. This material is not intended for distribution to, or use by, any person in any country or jurisdiction where such distribution or use would be contrary to local law or regulation. For further details see our full non-independent research disclaimer and quarterly summary.