



SP 500 Has the long term uptrend resumed
After rallying over 5% in January and then seeing a 11% peak-to-trough drop in February, the S&P 500 has seen quiet price action over the last three months.
Share this:

After rallying over 5% in January and then seeing a 11% peak-to-trough drop in February, the S&P 500 has seen quiet price action over the last three months. In fact, the index has spent the last 16 weeks contained to the range from just the first two weeks of February alone.
The recent consolidative price action reflects traders’ uncertainty as they weigh the bullish near-term fundamental catalysts against stretched long-term valuations. Tackling the short-term first, the Q1 earnings season was one for the record books for companies in the S&P 500. In aggregate, the index saw its earnings grow 25% in the first quarter, the highest growth rate since 2010 (though of course, much of this move was due to December’s large corporate tax cut and was discounted by the big rally through Q4 of last year and January). According to the earnings mavens at FactSet, nearly 80% of companies reported earnings above their mean estimate, the highest proportion on record.
Looking ahead, the strong earnings growth trend is expected to continue into Q2, with FactSet estimating an earnings growth rate of 18.9%. That said, investors have already taken that potential into account, so a merely “as expected” quarter is unlikely to provide fresh juice to US stocks. Furthermore, the market will be keeping a wary eye on the brewing trade war, as well as geopolitical tensions throughout the world. As a final headwind, US stocks are trading at elevated long-term valuations; though measures such as CAPE (the cyclically adjusted price-to-earnings ratio) are not effective timing tools, they do suggest that stocks may struggle to continue their long-term rallies at a certain point.
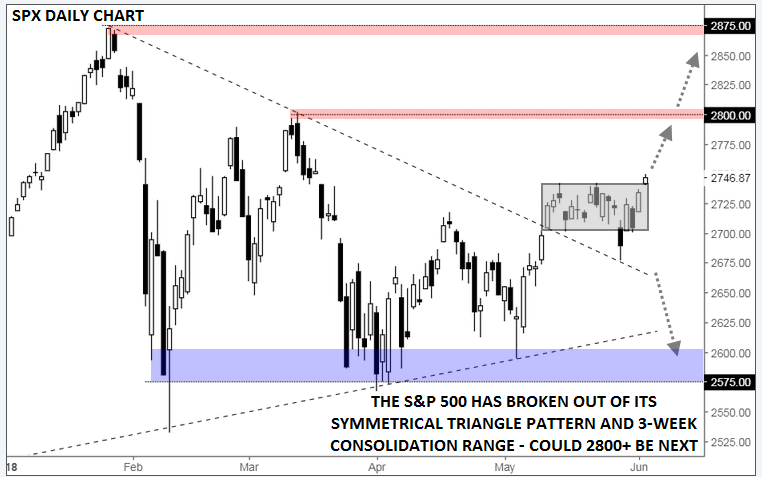
From a near-term technical perspective, the situation is looking increasing optimistic for S&P 500 bulls. The index has broken out of its 3-month symmetrical triangle pattern, and after retesting it from the topside last week, prices are trading up to an 11-week high this morning.
If bulls are able to maintain the upper hand in the coming days, the index could look to target the March highs near 2800; above that level, the record highs near 2875 may come quickly into play. On the other hand, a reversal to break below last week’s low would create a “false breakout” on the daily chart and open the door for a drop toward major year-to-date support in the 2575-2600 area.
Source: Trading View, FOREX.com
Latest market news




Open an account in minutes
Experience award-winning platforms with fast and secure execution.
Economic calendar
Web Trader platform
Our sophisticated web-based platform is packed with features.
Related articles
NZD/USD Forecast: Kiwi faces historic breakdown as RBNZ survey looms
NZD/USD is teetering above support that held through the pandemic and Liberation Day turmoil. With RBNZ hawks repeatedly disappointed, today's inflation expectations survey could open the door to a slide towards the GFC lows.
DXY, GBP/USD, AUD/USD, USD/CAD, USD/JPY, Gold Weekly Technical Outlook 11 16 2026
Sr. Technical Strategist Michael Boutros highlights the levels that matter on the USD Majors, commodities, and equity indices charts this week.

S&P, Nasdaq Slide as NVDA, AI Worries Continue to Build
It was a busy weekend in the headlines as a campaign to bring back Jensen Huang atop NVDA gained steam, even with accusations of possible treason and a circular funding model that has started to raise questions.

StoneX Financial Ltd (trading as "FOREX.com") is an execution-only service provider. This material, whether or not it states any opinions, is for general information purposes only and it does not take into account your personal circumstances or objectives. This material has been prepared using the thoughts and opinions of the author and these may change. However, FOREX.com does not plan to provide further updates to any material once published and it is not under any obligation to keep this material up to date.
This material is short term in nature and may only relate to facts and circumstances existing at a specific time or day. Nothing in this material is (or should be considered to be) financial, investment, legal, tax or other advice and no reliance should be placed on it. No opinion given in this material constitutes a recommendation by FOREX.com or the author that any particular investment, security, transaction or investment strategy is suitable for any specific person.
The material has not been prepared in accordance with legal requirements designed to promote the independence of investment research. Although FOREX.com is not specifically prevented from dealing before providing this material, FOREX.com does not seek to take advantage of the material prior to its dissemination. This material is not intended for distribution to, or use by, any person in any country or jurisdiction where such distribution or use would be contrary to local law or regulation. For further details see our full non-independent research disclaimer and quarterly summary.