



USD Majors, Gold, Oil, Bitcoin, Equities Weekly Technical Outlook
Sr. Technical Strategist Michael Boutros highlights the levels that matter on the USD Majors, commodities, and equity indices charts this week.
Share this:

Weekly Technical Trade Levels on USD Majors, Commodities & Stocks
- Technical trade setups we are tracking into the start of the week on the USD Majors, commodities, and equity indices.
- Next Weekly Strategy Webinar: Monday, July 13 at 8:30am ET
- Review the latest Video Updates or Stream Live on my YouTube playlist
In this webinar we take an in-depth look at the technical trade levels for the US Dollar (DXY), Euro (EUR/USD), British Pound (GBP/USD), Australian Dollar (AUD/USD), Canadian Dollar (USD/CAD), Japanese Yen (USD/JPY), Swiss Franc (USD/CHF), Gold (XAU/USD), Crude Oil (WTI), Bitcoin (BTC/USD), S&P 500 (SPX500), Nasdaq (NDX), and Dow Jones (DJI). These are the levels that matter on the technical charts into the weekly open. The assets are chaptered on the recording for your convenience.
US Dollar Index Price Chart – USD 240min
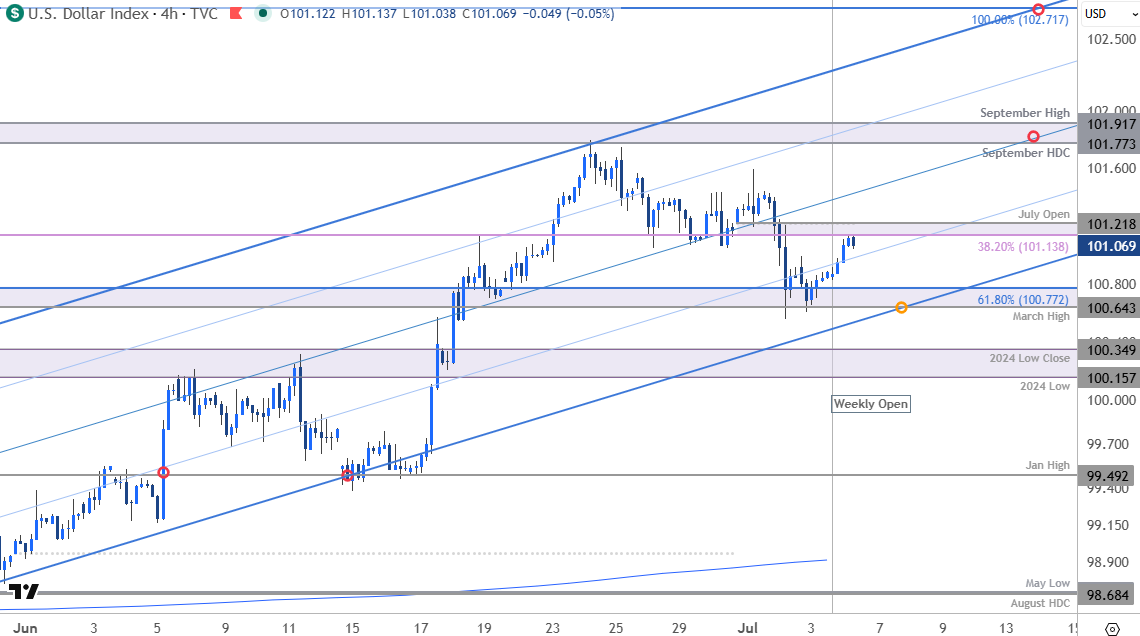
Chart Prepared by Michael Boutros, Sr. Technical Strategist; DXY on TradingView
Notes: The U.S. Dollar index rebounded off above pivotal support into the start of the month at the March high and the 61.8% extension of the January advance at 100.64/77. The recovery is now testing initial resistance at 101.14/22- a region defined by the 38.2% retracement of the 2025 decline and the objective monthly open. The immediate focus is on a breakout of this range into the start of the week for guidance.
A topside break would threaten another test of key resistance at the September high-day close (HDC) / high at 101.77/92 – a breach / close above this zone would be needed to mark uptrend resumption and fuel the next major leg of the advance. The next major technical consideration is eyed at the 100% extension at 102.70.
A break below this upslope exposes key support and broader bullish invalidation at t the 2024 swing low / low-close at 100.16/35. Losses below this threshold would suggest a more significant high is in place and a larger trend reversal is underway. Subsequent support rests with the January high at 99.49.
Bottom line: The U.S. Dollar rebounded off support last week with the weekly & monthly opening ranges taking shape just above. Look for a breakout in the days to ahead for guidance here. From a trading standpoint, losses should be limited to 100.16 IF price is heading higher on this stretch with a close above 101.92 ultimately needed to fuel the next major leg of the advance.
The economic calendar is relatively light next week, leaving Wednesday's release of the FOMC minutes as the week's marquee macro event. Investors will be looking for greater insight into the Committee's internal discussions, particularly the breadth of support behind the hawkish shift in the latest dot plot, the upward revision to inflation projections, and policymakers' assessment of labor market conditions following June's softer-than-expected employment report. Stay nimble into the release and watch the weekly close for guidance. Review my latest US Dollar Forecast for a closer look at the longer-term DXY technical trade levels.
AUD/USD

Australian Dollar Price Chart – AUD/USD 240min
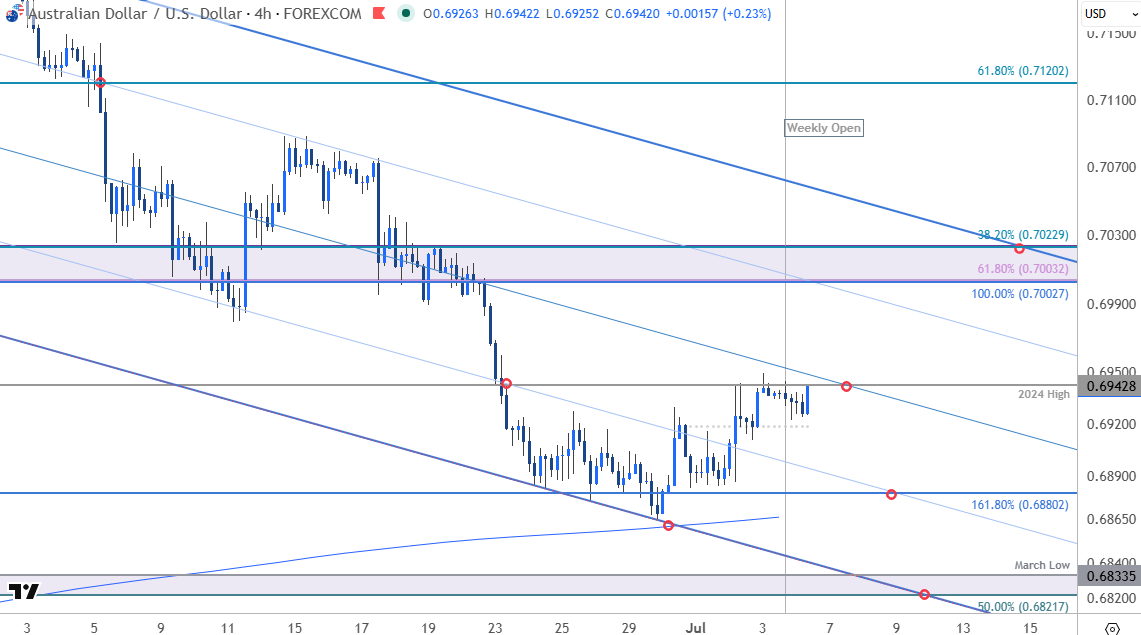
Chart Prepared by Michael Boutros, Sr. Technical Strategist; AUD/USD on TradingView
Notes: Aussie rebounded off confluent downtrend support last week with the recovery now approaching resistance at the median line / 2024 swing high at 6942. Looking for a potential reaction here for guidance.
A topside breach opens the potential for a test of more significant downtrend resistance with broader bearish invalidation steady at 7003/23- a region defined by the 61.8% retracement of the March rally, the 100% extension of the May decline, and the 38.2% retracement of the May selloff. Note that the upper parallel converges on this zone next week and a breach / close above this slope would suggest a more significant low is in place and a lager reversal is underway.
Monthly open support rests at 6918 with a break below the 61.8% extension and the 200-day moving average at 6868/80 needed to fuel the next leg of the decline. Note that the lower parallel converges on the 50% retracement and the March low at 6822/33 later this week.
Bottom line: A rebound off downtrend support is testing initial resistance at the median line and the focus is on a reaction here early in the week. From a trading standpoint, rallied would need to be limited to 7023 for the May downtrend to remain viable with a break below the 200-day moving average needed to fuel the net major leg of the decline.
Economic Calendar – Key Data Releases
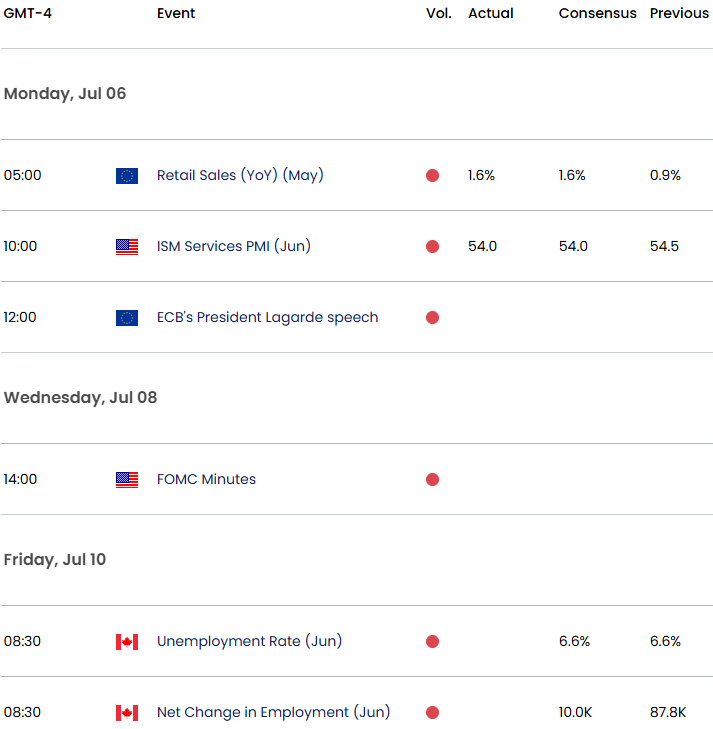
Economic Calendar - latest economic developments and upcoming event risk.
--- Written by Michael Boutros, Senior Technical Strategist
Follow Michael on X @MBForex


Open an account in minutes
Experience award-winning platforms with fast and secure execution.
Economic calendar
Web Trader platform
Our sophisticated web-based platform is packed with features.
Related articles
China's steel slump leaves iron ore bulls under the pump
Iron ore has broken major support, threatening a return to the lows of 2022 as mounting evidence of weakness in China's steel sector reinforces the bearish outlook.

NZD/USD Forecast: Kiwi faces historic breakdown as RBNZ survey looms
NZD/USD is teetering above support that held through the pandemic and Liberation Day turmoil. With RBNZ hawks repeatedly disappointed, today's inflation expectations survey could open the door to a slide towards the GFC lows.

USD/JPY, AUD/JPY: Central Bank Divergence Creates Two-Way Risk
USD/JPY eyes a breakout above 160, while AUD/JPY faces further losses as Fed, RBA and BoJ interest rate expectations diverge.

StoneX Financial Ltd (trading as "FOREX.com") is an execution-only service provider. This material, whether or not it states any opinions, is for general information purposes only and it does not take into account your personal circumstances or objectives. This material has been prepared using the thoughts and opinions of the author and these may change. However, FOREX.com does not plan to provide further updates to any material once published and it is not under any obligation to keep this material up to date.
This material is short term in nature and may only relate to facts and circumstances existing at a specific time or day. Nothing in this material is (or should be considered to be) financial, investment, legal, tax or other advice and no reliance should be placed on it. No opinion given in this material constitutes a recommendation by FOREX.com or the author that any particular investment, security, transaction or investment strategy is suitable for any specific person.
The material has not been prepared in accordance with legal requirements designed to promote the independence of investment research. Although FOREX.com is not specifically prevented from dealing before providing this material, FOREX.com does not seek to take advantage of the material prior to its dissemination. This material is not intended for distribution to, or use by, any person in any country or jurisdiction where such distribution or use would be contrary to local law or regulation. For further details see our full non-independent research disclaimer and quarterly summary.